Results
Output from the deep learning module can be viewed in PAMGuard viewer mode, or extracted from binary files using MATLAB or R.
PAMGuard viewer mode
Detections form continuous raw data are shown in the datagram in the same way as all data streams in PAMGuard.
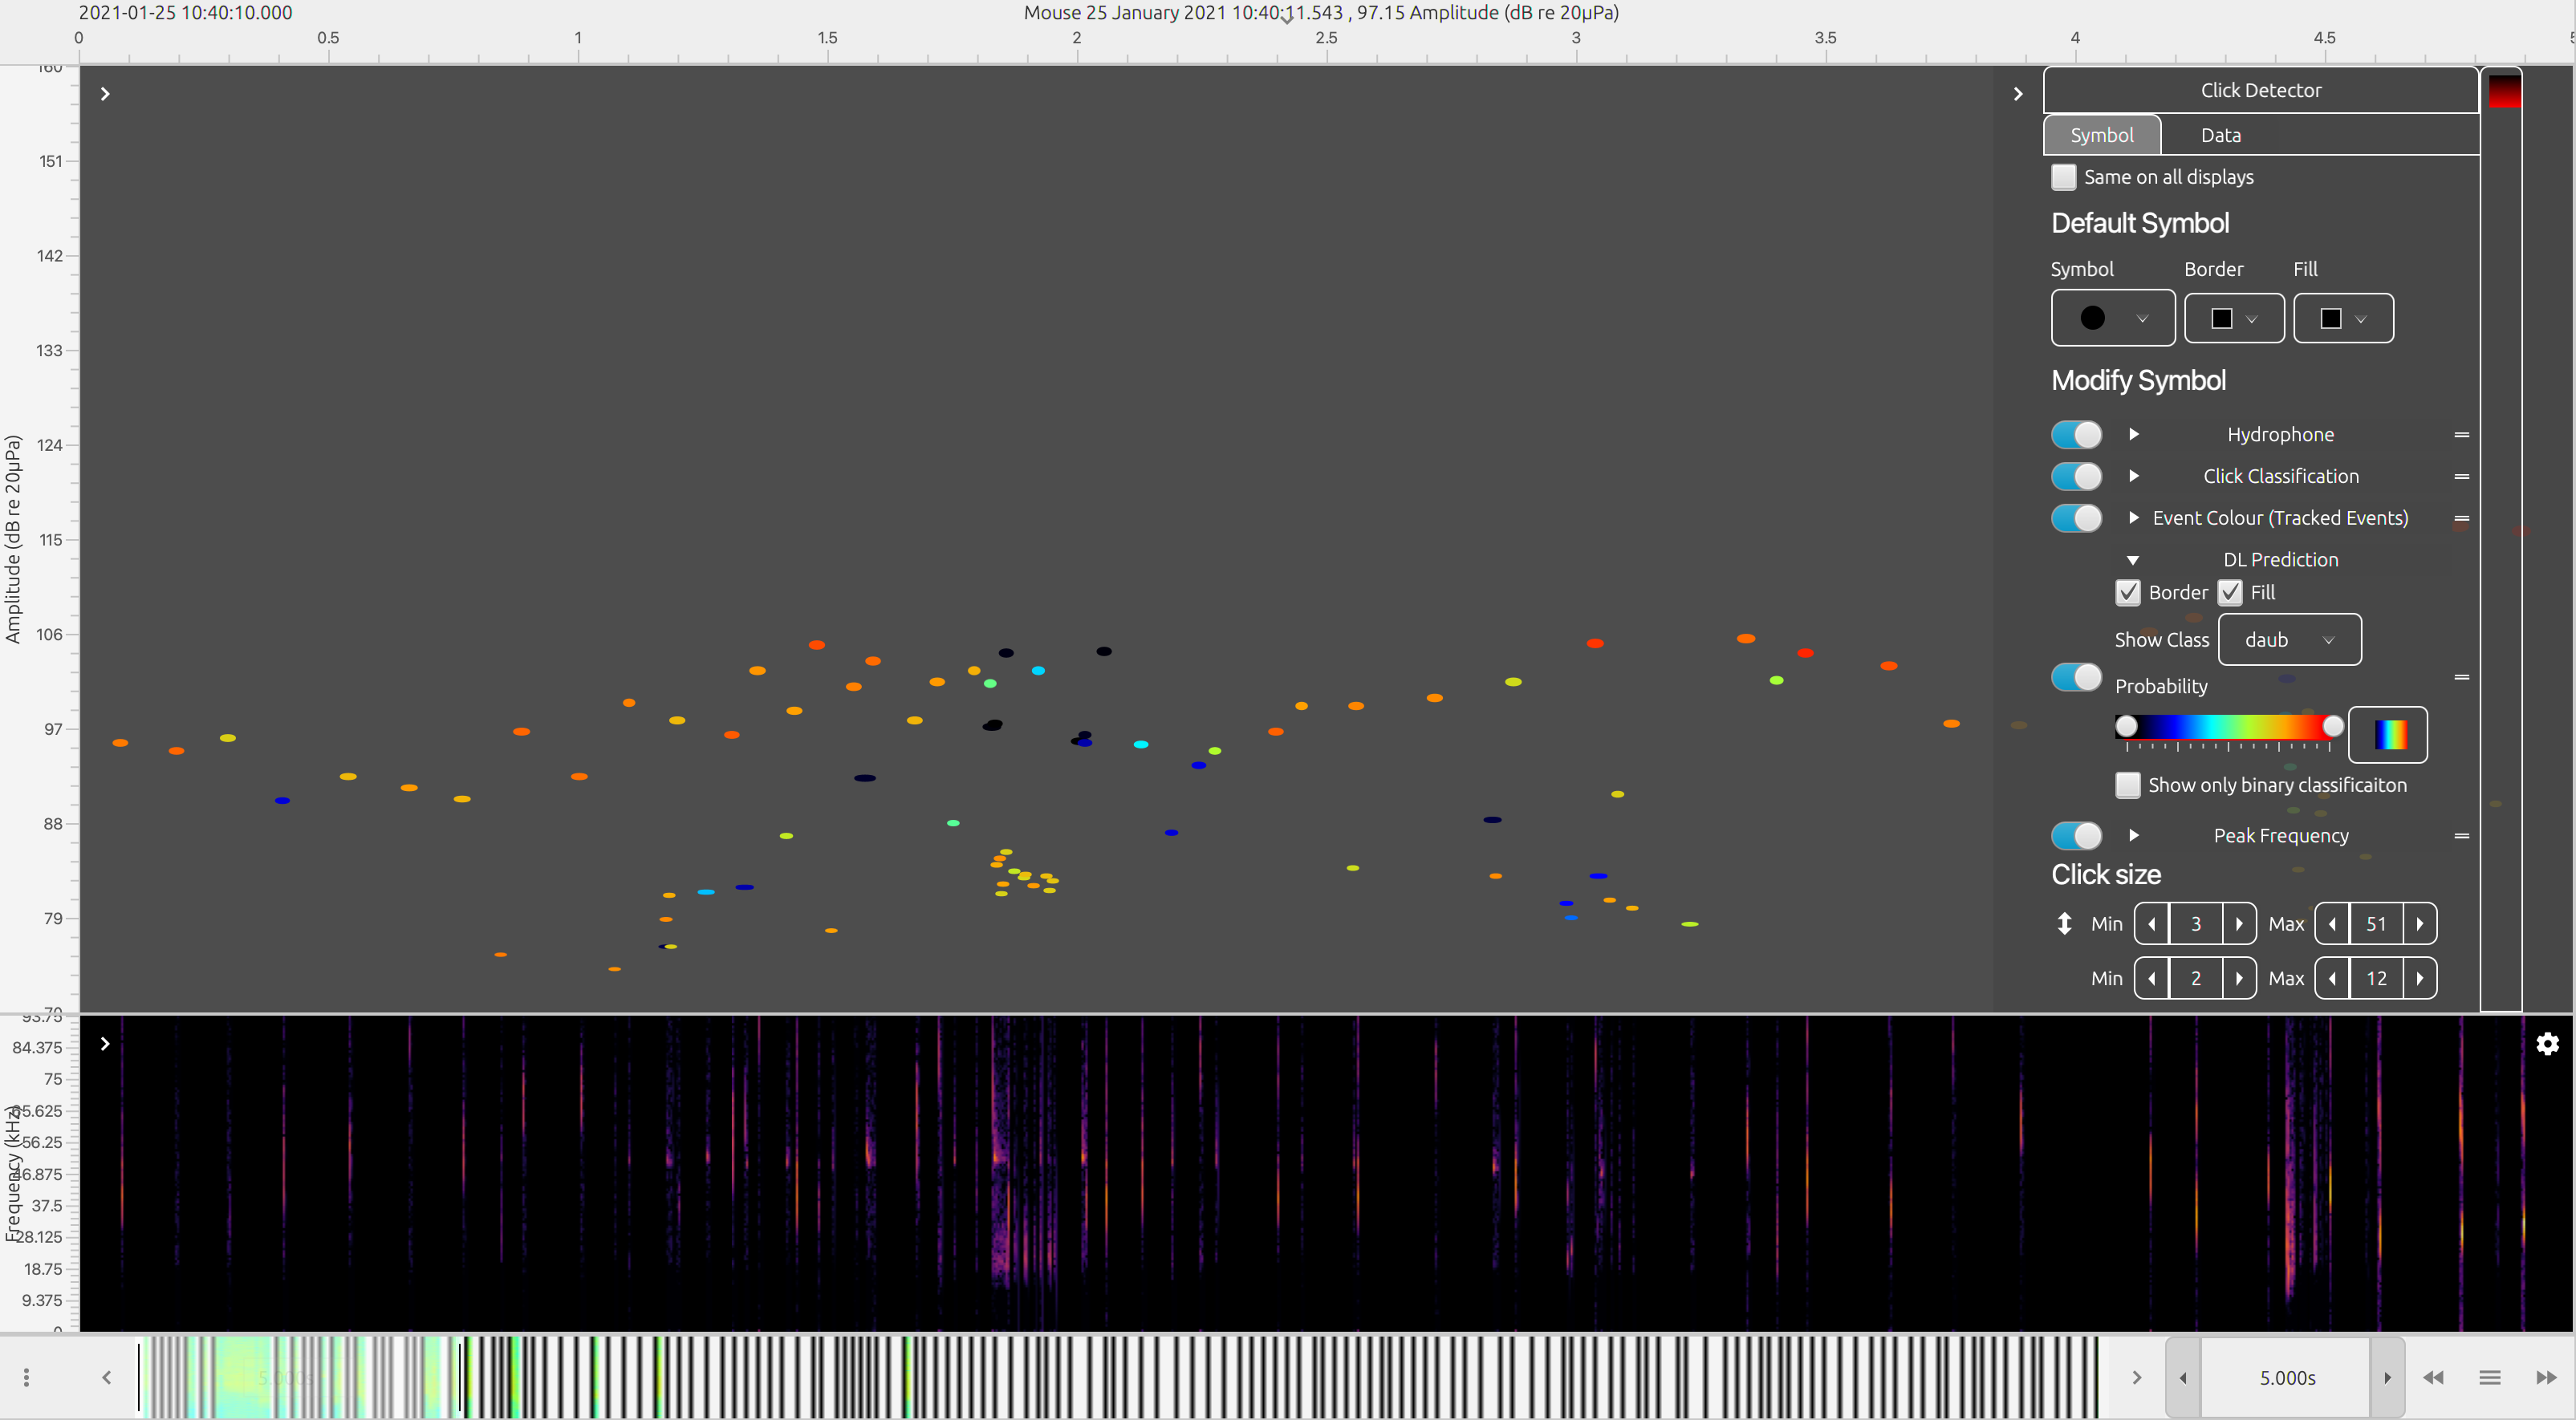
The Time base display FX is best way to view detailed data outputs from the deep learning algorithm. The time base display can display almost all data types in PAMGuard on a large variety of different data axis. For example, click detections can be displayed on an amplitude, bearing, ICI, waveform and/or frequency axis. Deep learning detections (i.e. data units which have been saved from raw data using the deep learning detector) can be displayed on the time base display in the same way as many other detections and in addition, there is a symbol manager options which allows the deep learning detections or other detections which have been classified by the deep learning module to be coloured by prediction class. This means that a manual analyst can quickly navigate to detections with high prediction values for a certain class. Hovering over or right clicking on a data unit in the time display and selecting the information button, will show the data unit’s metadata, including the prediction values for all output classes from the deep learning model.

An example click detection module output coloured by deep learning annotations. Click detections are annotated with the results from the deep learning module. The symbol manager in the time base display can be used to colour the clicks by the prediction for a selected class
Other displays also show outputs from the deep learning module. Hovering over data units in the click display will, for example, show deep learning prediction values. The spectrogram will also show deep learning detections as translucent blue boxes (these must be selected in the right click menu).
MATLAB
The easiest way to export to MATLAB is to select the desired units in the time base display, right click and select the MATLAB icon. Data units will be exported to a .mat file as list of structures which is then saved to the clipboard. This file can be saved and then dragged into MATLAB to open.
Where it is necessary to further analyse large datasets produced by PAMGuard, there is a MATLAB-PAMGuard library which can directly import the binary files which store PAMGaurd detection data. The library is simple to use with the primary function being loadPAMGuardBinaryFile.m. This will load any binary file type (e.g. clicks, whistles, deep learning detections) and return a list of data structures with the detection data. The structures include annotations where deep learning predictions are stored.
Here is a simple example loading up all the deep learning detections for a right whale classifier.
% the folder containing PAMGuard binary files
folder = '/Users/me/right_whale_project_1/PAMBinary/';
%load all the detections in the folder
dldetections = loadPamguardBinaryFolder(folder, 'Deep_Learning_Classifier_Raw_Deep_Learning_Classifier_DL_detection_*.pgdf')
The predictions for each class (in this case the classes are noise and right whale) are easily accessed in the structure via;
%% access the prediction form the first detection
predicitons = dldetections(1).annotations.dlclassification(j).predictions;
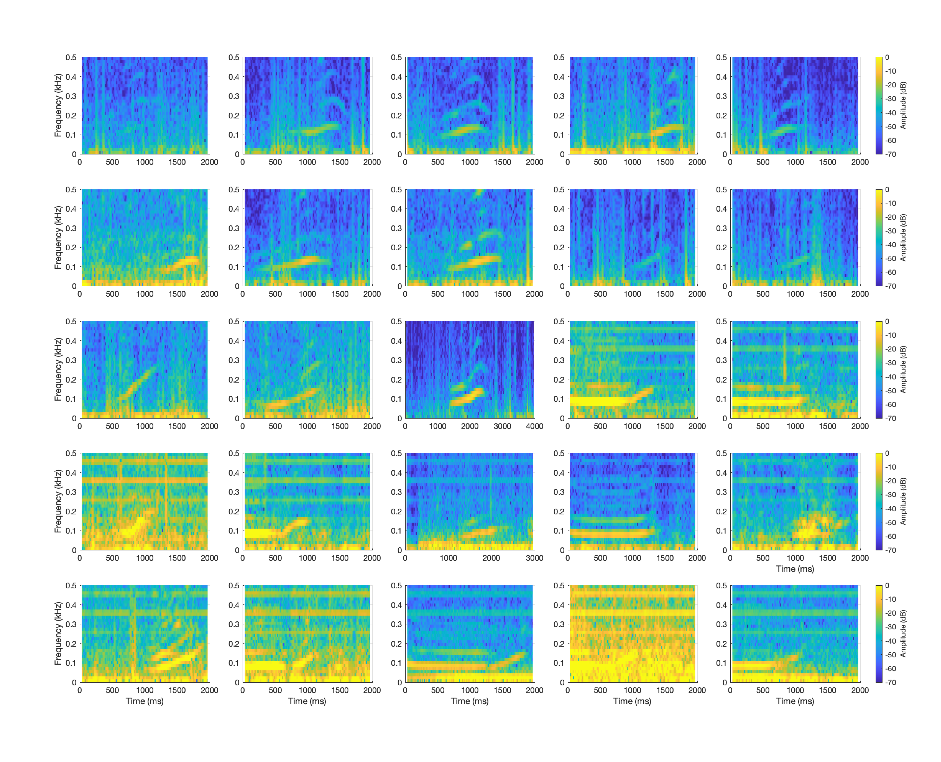
The loaded detections can then be plotted by accessing the waveform data in each structure;
% plot all the spectrograms.
clf
tiledlayout(5,5)
for i=1:length(dldetections)

   nexttile

   % generate the data for a spectrgram
   [s, w, t] = spectrogram(dldetections(i).wave,512, 384,[],sR,'yaxis');

   % create the time and frequency matrices required to plot a surface
   [X, Y] = meshgrid(t,w);
   % plot the surface (divide and multiply by 1000 to show milliseconds and kHz respectively)
   surf(X*1000, Y/1000, 20*log10(abs(s))-140, 'EdgeColor', 'None')
   view([0,90])

   caxis([70, 140]-140)
   ylim([0,0.5]);
   xlabel('')
   ylabel('')

   if (mod(i,5)==0)
      c = colorbar;
      c.Label.String = 'Amplitude (dB)';
   end

   %x axis only on bottom plots
   if (i>=20)
      xlabel('Time (ms)')
   end

   %y axis only on left most plots
   if (mod(i-1,5)==0)
      ylabel('Frequency (kHz)')
   end
end
Right whale detections from a deep learning model imported and then plotted in MATLAB
R
In the same way as MATLAB export, the PAMGuard time base display and export selected data units directly to an R struct which can be imported easily into R..
R also has a well supported PAMGuard library with like for like functions compared to the MATLAB library. The PAMBinaries R library can be found here.