Classifier Output
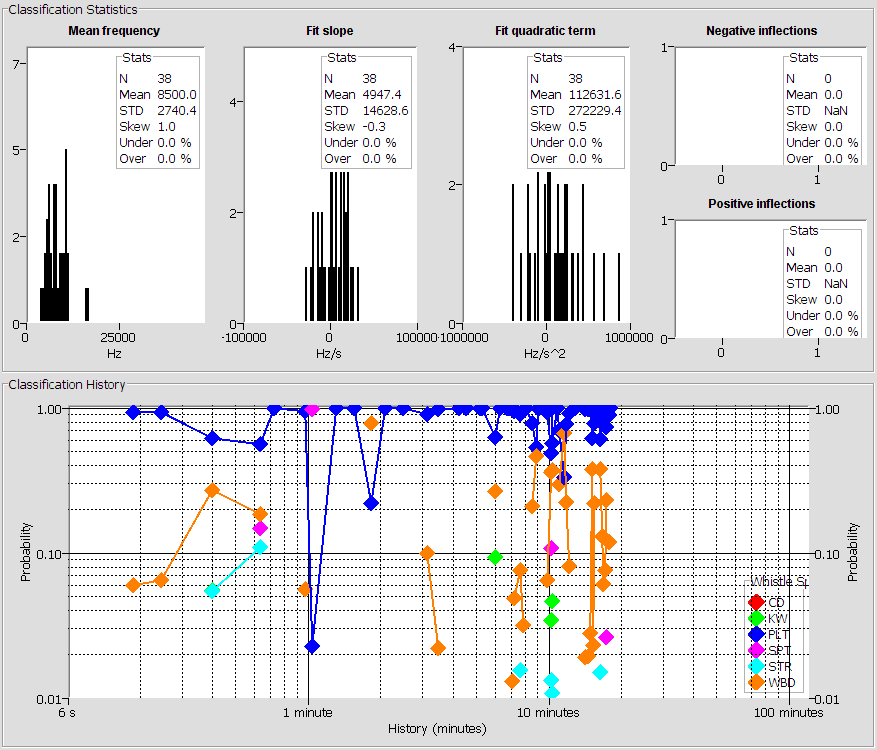
Classifier output is shown graphically on a tab on the main PAMGuard display.

Parameter Distributions
The top half of the display shows the distributions of parameters extracted from each whistle fragment (Note that the negative and positive inflections are not currently used).
Classifier History
The bottom half of the display shows the classification history.
Each time the parameter distributions build up enough data and the classification runs, the classification probability for each possible species with a probability > 1% (0.01) is displayed
The time axis of the display is logarithmic, so recent history (i.e. what’s happened in the last minute) gets as much space as the preceding 10 minutes or the 100 minutes before that. A total of two hours of data are shown.
Database Output
If a Database is being used, each classification result is also written to the database.