Graphic Overlays
PAMGuard Map
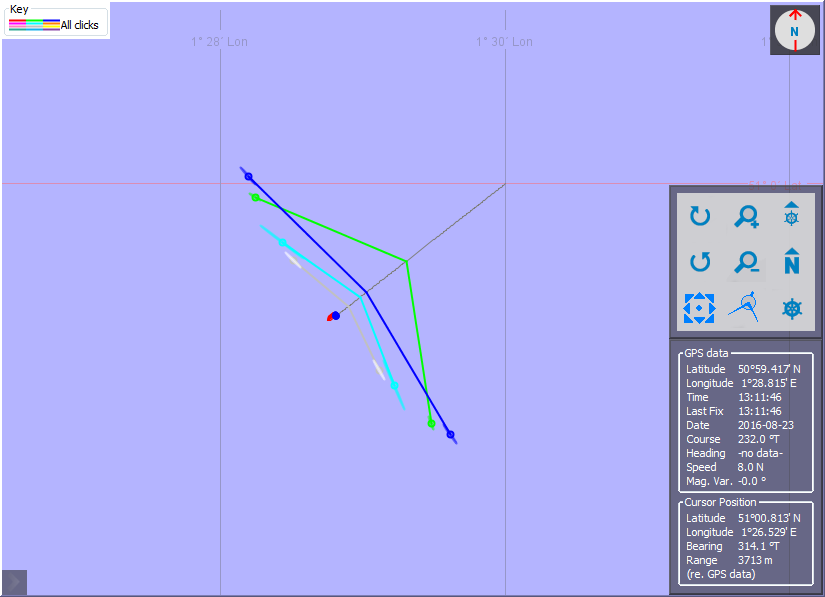
Data can be overlaid on the PAMGuard map at three different levels: Clicks, Tracked Clicks and Tracked Events. Overlaying all clicks will generally display too much data and can slow PAMGuard down. However this can be useful if the map options are used to only display a few seconds of the most recent data. Tracked Clicks and Tracked events will be shown if click trains are manually or automatically detected (see Click Train Identification). Event localisations will start to show as soon as two or more clicks are marked or sufficient clicks have been automatically assigned to a click train for target motion analysis. If a localisation has not been calculated, then just a bearing line to the first click in the train will be shown.

Spectrogram
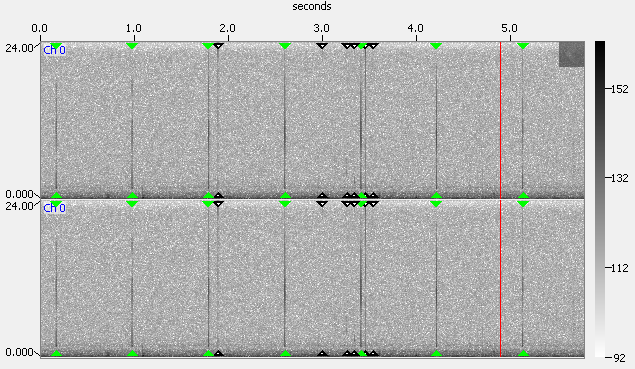
Clicks can be shown as an overlay on the spectrogram. They will appear as small triangles at the top and bottom of the display.

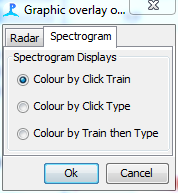
The colour of the triangles can be the colour of the species id of a single click, the colour assigned to a click train or a mixture of both � using the click train colour if one is assigned, otherwise using the individual click classification. To control the colours, go to Click Display>Display Overlays and select the option you require.

Radar Display
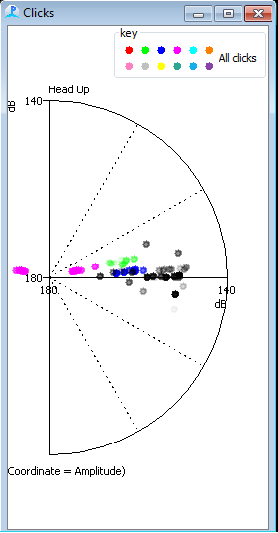
Bearing and amplitude of single clicks or bearing and range of localised click trains can be shown on the radar display. As with the spectrogram, the colour of individual clicks can be set from the Click Display > Overlays menu.
