Classifier with frequency sweep
Overview
The click classifier with frequency sweep was added to PAMGuard in 2010 to provide a wider choice of species identification parameters, particularly for the detection of beaked whales.
Operation is similar to that of the Basic click Classifier in so much that a number of different tests can be carried out on each click and the click will have to satisfy all of those tests in order to be classified.

General options
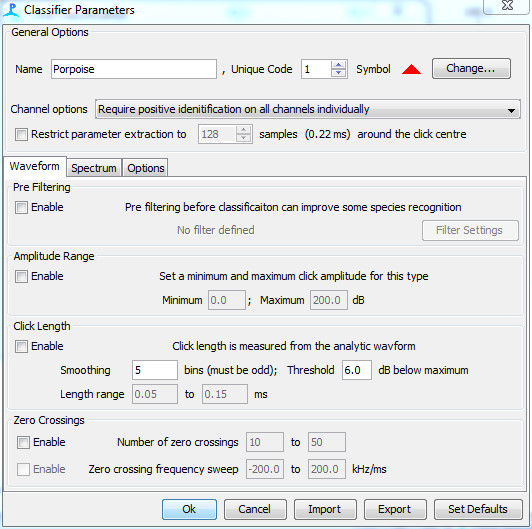
In the general options section, enter the species name, a unique identification code and select the symbol to be used for this species on the click detector display.
Channel options
Click detection is generally conducted on more than one channel. If this is the case, then the click classifier can be set to either:
Require positive identification on all channels individually
Require positive identification on only one channel
Use mean parameter values over all channels
Restricting the click length
Click waveforms from the click detector are generally longer than the click itself. This is partly due to the pre and post samples added to the waveform but can also be caused by the click arriving at different times on different channels. The addition of extra waveform data before or after the click has little effect if the click has a high signal to noise ratio, but for quiet clicks, the additional data is a significant source of noise for some parameter measurements. There is therefore an option to restrict the length of the data used in the parameter extractions. If this option is used, then the peak of the waveform envelope is found (see Click Length below) and an equal amount of wave data taken from each side of the envelope maximum.
Generally the click length should be set to a power of 2 (e.g. 128, 256, 512, etc) since the FFT’s used in many of the calculations require data that is an exact power of 2 long. Other values can be used, in which case the shortened data will be padded with zeros prior to FFT calculations.
Waveform Options
The first tab “Waveform Options” controls classification parameters relating to the click waveform
Pre Filtering
Select this option if you want to filter the click prior to parameter extraction. Generally measurements such as the click length will be more accurate if unnecessary noise is first filtered from the click
Amplitude Range
This option can be used to exclude very quiet of loud clicks. Quiet clicks in particular tend to cause false classification since their properties are poorly defined so they tend to mis-classify at random
Click Length
The click length is measured by first calculating the analytic waveform (or signal envelope) of the click using the Hilbert transform of the waveform data
This is then smoothed using a moving average filter defined by the user (smoothing parameter in dialog).
The maximum of the smoothed envelope is then found and the click length taken as the length of the data between points either side of that maximum which remain above the maximum value minus the threshold (Threshold parameter in dialog).
The test is passed if the click length lies within the range set by the user (Length range parameters in dialog).
Zero Crossings
Some species of whale produce frequency modulated clicks, i.e. the click frequency changes during the course of the click.
The power spectrum of a click is an average of the spectral energy over the duration of the click and is therefore unable to show changes in frequency during the course of the click.
Although it is possible to extract more detailed frequency information using a Wigner-Ville transform of the waveform data. These are slow to compute and therefore not suitable for real time classification.
The classifier therefore extracts frequency information by examining zero crossings of the waveform data.
A zero crossing is defined as the signal waveform going from a positive to a negative value or vice-versa. The classifier searches the waveform for zero crossings only within the region of the click between the thresholded limits from the click length estimation described above.
Once zero crossings have been found, the frequency between each zero crossing is calculated. If there are three or more zero crossings (permitting two or more estimates of frequency) the frequency sweep is calculated by fitting a linear model of frequency against time.
Two tests can then be applied to the data. The first is the total number of zero crossings which must lie within the range set in the dialog. The second is the frequency sweep estimated from the zero crossing data.
Spectrum Options
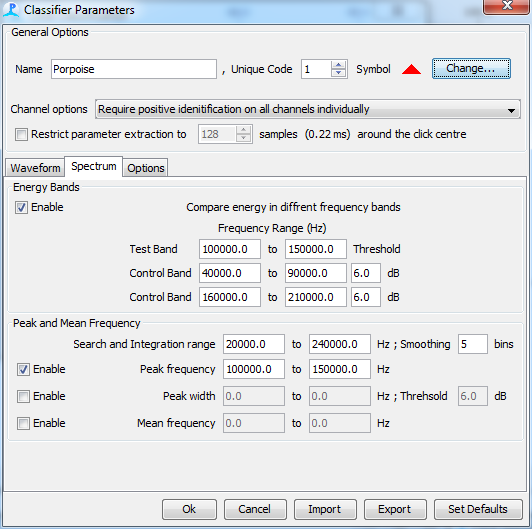
The second tab controls classification parameters extracted from the clicks spectrum

Energy Bands
The energy band test compares the acoustic energy in a test band with the energy in two control bands.
The user should enter the frequency ranges of each band and a threshold value for each of the control bands. The test is passed if the test band energy exceeds each of the control band energies by more than the threshold values.
If only one control band is required, set both frequency limits of the second control band to zero.
Peak and Mean Frequency
The peak and mean frequency are measured from the power spectrum of the click waveform.
Search and integration range
The peak search and the frequencies over which the mean frequency is summed can be restricted using the search and integration range parameters in the dialog.
The power spectrum can also be smoothed using a moving average filter to remove noisy spikes from the spectral data.
Peak Frequency
If the peak frequency test is enabled, the peak frequency (taken as the highest point in the smoothed spectral data between the limits of the Search and Integration range) must lie between the limits entered in the dialog.
Peak Width
The width of the spectral peak is measured by first finding the amplitude of the power spectrum at the peak frequency. The peak width is taken as the frequency range of the data either side of that peak which are at an amplitude above the peak amplitude minus the threshold (threshold parameter in dialog). The test is passed if the width of the peak lies within the set range.
Mean Frequency
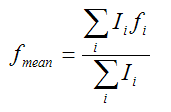
The mean frequency is calculated using

where
i is the range of frequency bins within the search and integration range
I is the intensity of the spectrum at each frequency bin i
f is the frequency (Hz) at each frequency bin i
The test is passed if the mean frequency lies within the set range.
Other Options
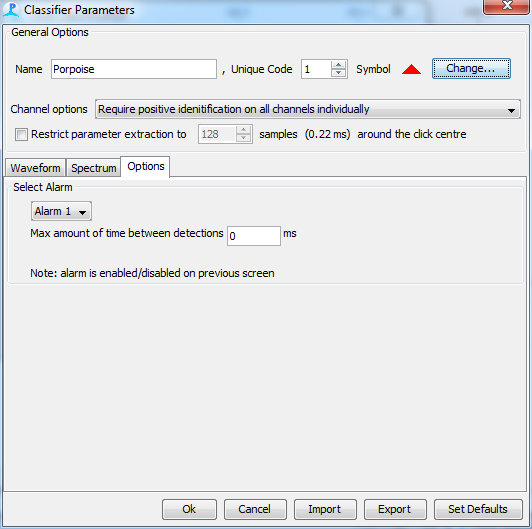
The third tab controls other options

Alarm
You can create an audible alarm by setting an alarm on the tab and by enabling it on the more general classifiction panel
Species Default settings
The ‘Species Defaults’ button allows the user to use stored standard settings for beaked whale and harbour porpoise classifiers.