Marking out Events
The PAMGuard viewer click detector has the ability to allow manual marking of events. Events usually consist of a group of clicks associated with one acoustic encounter of a particular species. Event information is saved to the database and in certain situations, such as when using towed arrays, can be used to localise an animal?s position.
Creating an Event
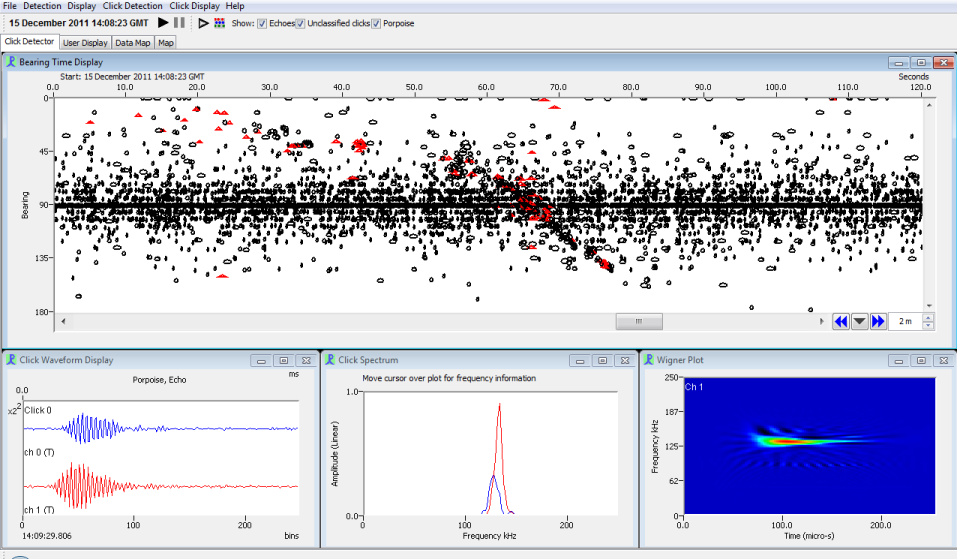
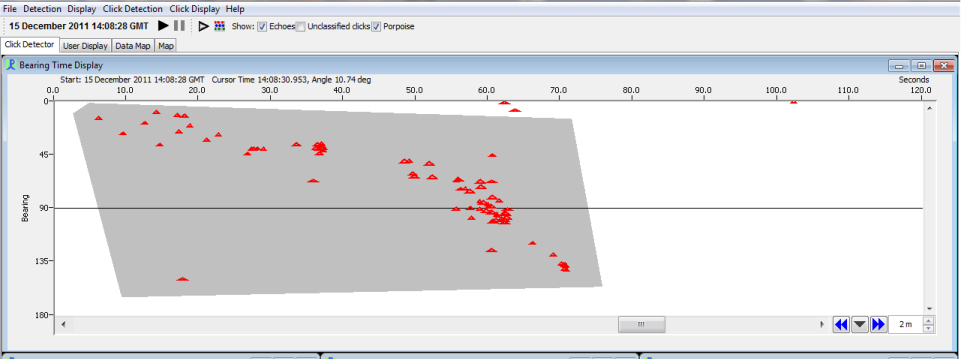
To mark an event bring up the bearing/amplitude time display (in the Click Detector tab). The Figure shows a porpoise click train which needs to be marked and stored as an event. Note that the bearing time display is very similar to the online version just that instead of the trigger window you get a Wigner plot as default setting.
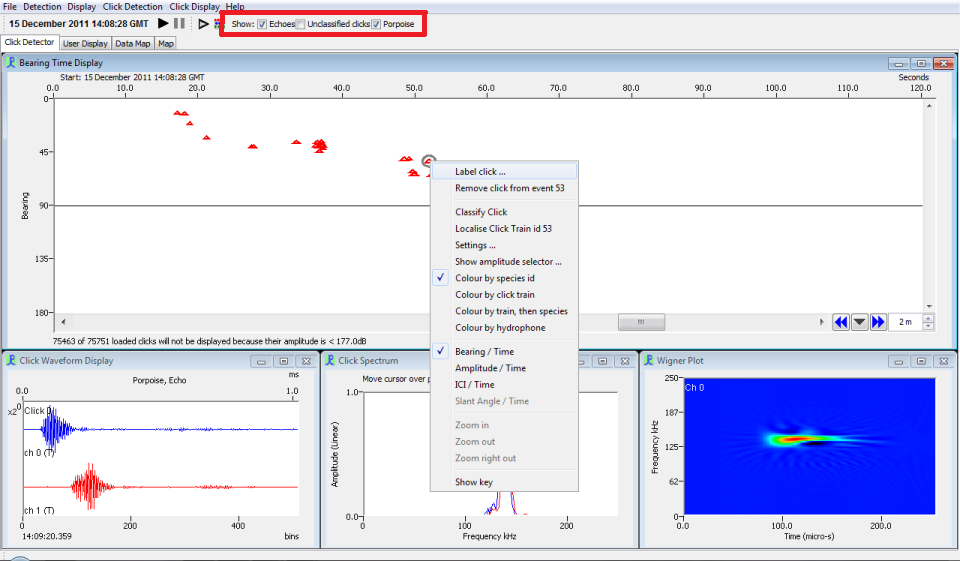
To see the classified clicks better (in this case porpoise clicks - the red triangles) you can untick the box at the top of the window ‘Unclassified clicks’. The bearing time display will now only show the classified clicks (depending on your settings you have more options i.e. echos, other species, etc.). Right click on a click and select ‘Label click…’.
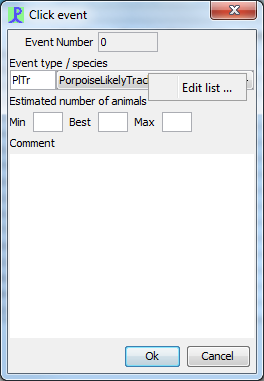
This will bring up the event dialog box. Here you can create a new event by selecting the ‘New Event’ button or add the click to an existing event by selecting any event from the Event list.
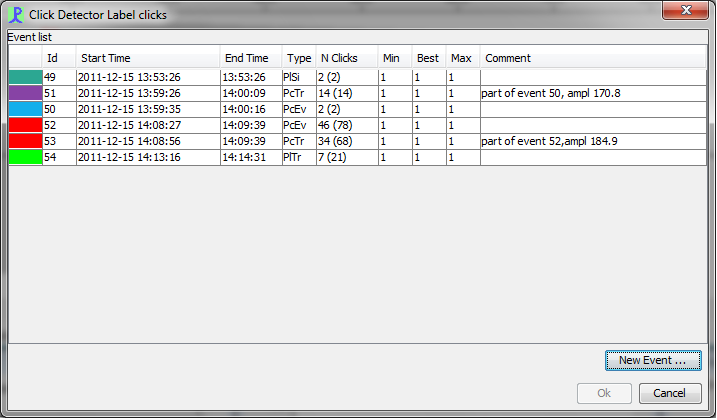
When creating a new event the species/event type can be selected from the drop down menu. To add a new species/event type to the database simply right click on the drop down menu and select ‘Edit list’.
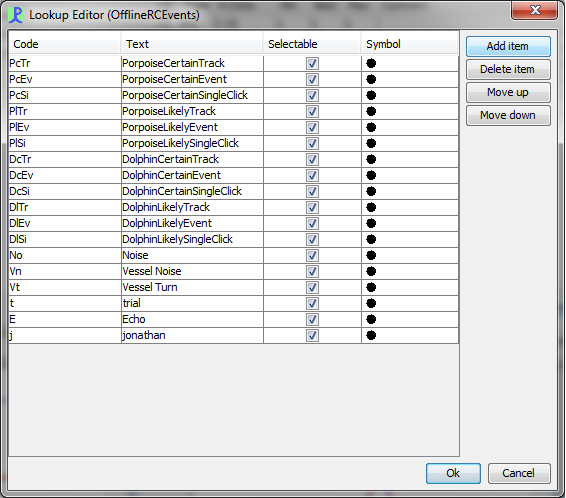
In the Lookup Editor window select ‘Add Item’ and create a Code, Text and Symbol for your new species/event type. Press ok. Now you can select your new Event type/species from the drop down list in the click event dialog (previous figure). The Estimated number of animals and the comment are optional but always useful to fill in. (Note: Dont worry about the event number, PAMGuard creates an ID automatically.)
Multiple clicks can be selected using the advanced area selection tool. Double click on the bearing/amplitude time display. This will bring up a dotted line which you can use to draw around a group of clicks. By joining up the ends of the dotted line the selected area should appear grey.
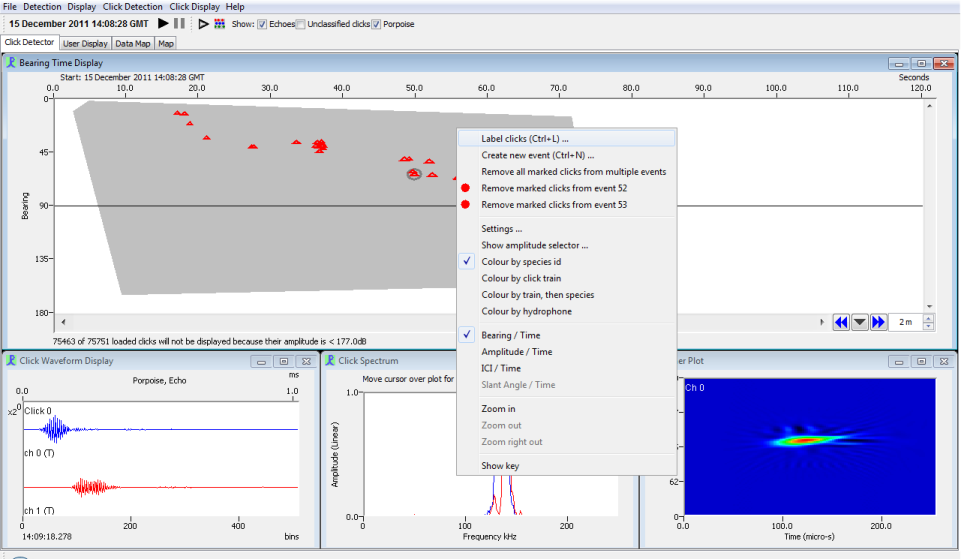
All the clicks within this grey area can be added to an event by right clicking inside the grey area and selecting ‘Label Clicks’ or use the key short cut ‘Ctrl+L’. Note that there are also other options available such as removing clicks from a certain event etc. So if you made a mistake, don?t panick. Other useful tools for marking an event include the amplitude selector and zoom selection.
Following the described steps your event is saved. You can now localise it with target motion analysis.
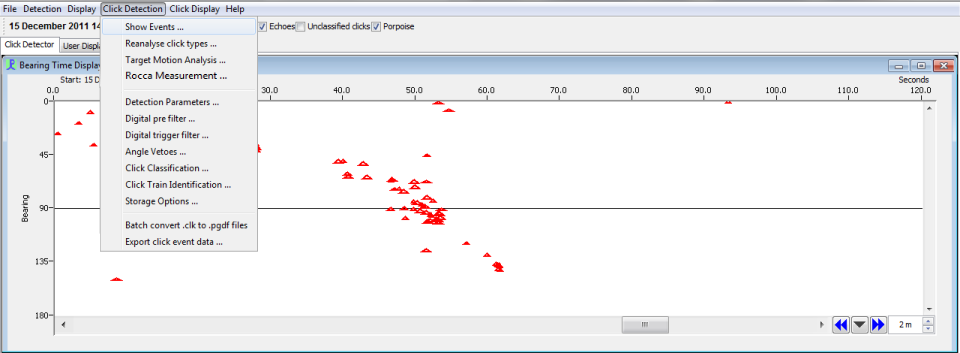
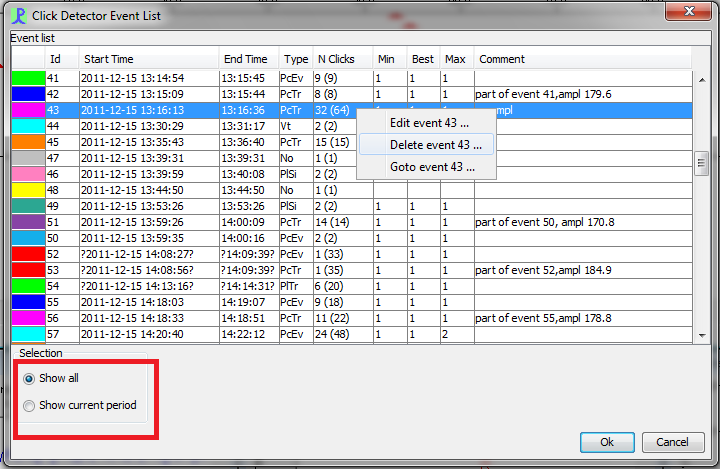
All events are saved in the database. To get an overview about your events go to ‘Click Detection’ and then ‘Show events’.
Depending on your selection you see all events in your data set or only the ones which are in the current period. Right click on an event and you have the option for editing, deleting or going to the event. This comes in handy when you want to move between events.
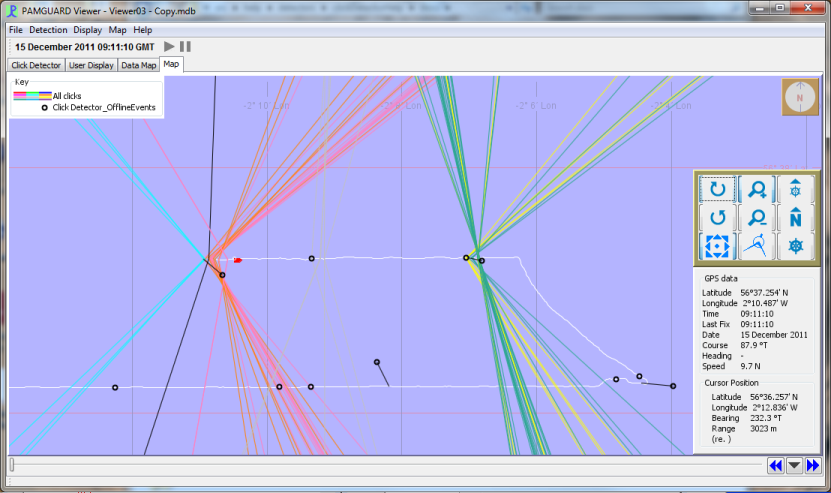
Events which contain clicks with bearing information can be viewed in the map tab- simply right click and select ‘Click Detector, Tracked Clicks’. If using a towed array events can be localised using the target motion analysis module. Localisation information will also be displayed on the map.
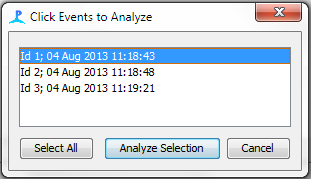
You can also send Events to Rocca for click analysis. Go to ‘Click Detection’ and then ‘Rocca Measurement’. A new window will open up displaying all of the currently defined events. Select the events to analyse, and then click ‘Analyze Selection’
