Displays
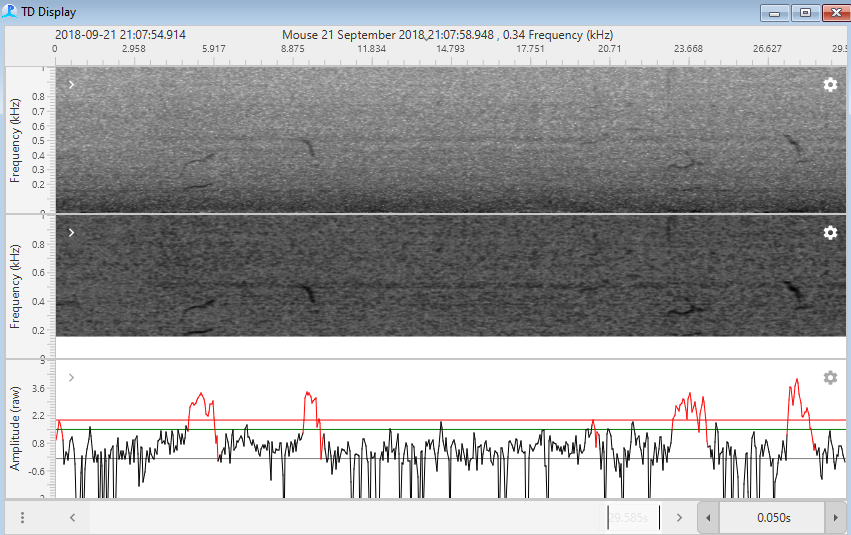
The whitened spectrogram is only calculated for the frequency range specified in the settings, with data at other frequencies set to 0. It can be viewed either using the Spectrogram Display or the Time Display FX. In either case simple select the GPL Whitened Spectrogram as the data source. Note however, that during the whitening process the scale of the data changes, so the displayed amplitude values no longer have any meaning.

Figure showing an FX display with raw spectrogram data, whitened spectrogram data and the GPL detection function
GPL detection overlays
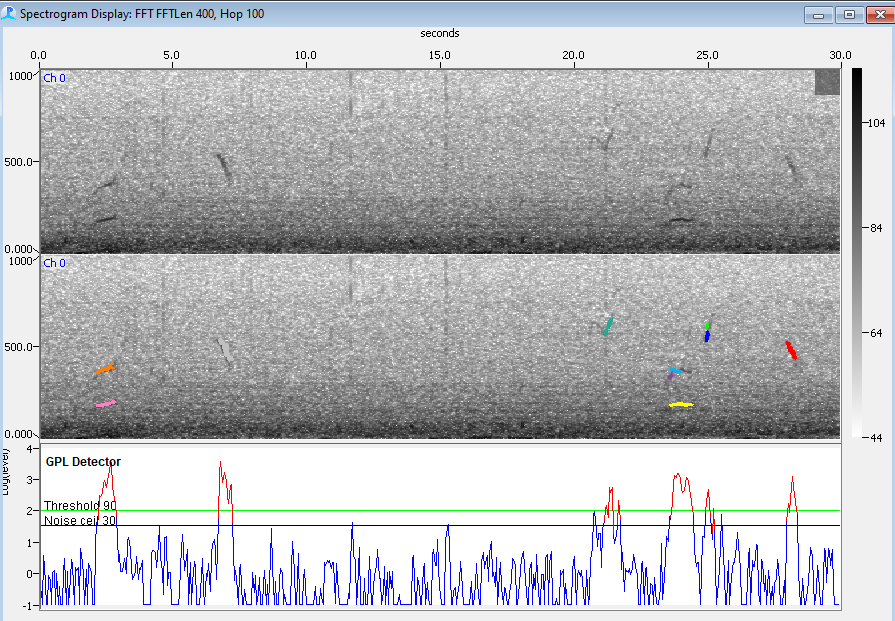
Detected contours can be displayed as overlays on the Spectrogram Display. Simply right click on the display and select GPL Detector Detections. To change colour options, click on the small options button to the left of the menu item.

Figure showing a Spectrogram display with spectrogram data on it’s own and overlaid with GPL detections
Similarly, GPL detections can be shown as overlays on the PAMGuard map. If GPL detections have been localised bearing lines and / or 2D or 3D localisations will be displayed.
Detection Statistic / Trigger Function
Viewing the summed power in the detection frequency band is a useful way of checking on detector performance. The statistic for each channel the detector is running on can be shown as a line graph in the Spectrogram Display or the Time Display FX.. To view the data, once you’ve created the GPL Detector and the Time Display, simply add “GPL Level” to a display graph as shown in the examples above.