Overview
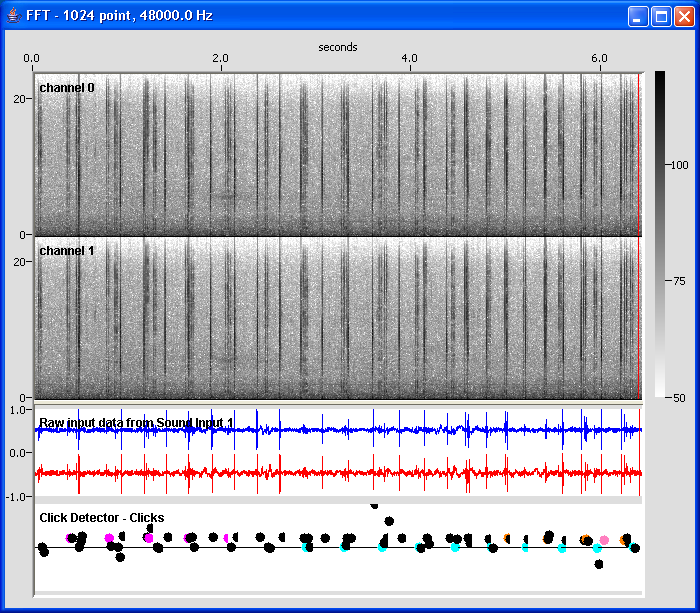
Spectrogram windows not only display spectrograms, but they can also form a container for plug in graphics modules for detector data that is to be displayed beneath the spectrogram windows or in the case of the whistle detector, on top of it.

Each spectrogram display contains two main section divided by a movable divider that can be used to alter the size of each section.
Each section may be divided into several sub-displays.
The top section (which always exists) displays a number of spectrogram windows with optional graphic overlays from some PAMGuard detectors
The bottom section (which is optional) displays plug in displays from other parts of the PAMGuard system for showing data such as waveforms, detector output, trigger functions, etc. Data shown in the plug in panels will scroll in synchrony of the spectrogram data in the top section.
The types of plug in panels available will depend on the current PAMGuard configuration.