Configuring a Spectrogram Display
Spectrogram display options are specified when the display is first created; in addition, they can be adjusted at any time using the popup menu accessed by right clicking on the spectrogram plot and selecting >Settings…
The Spectrogram Display Parameters Dialog has four tabs:
Data Source Tab

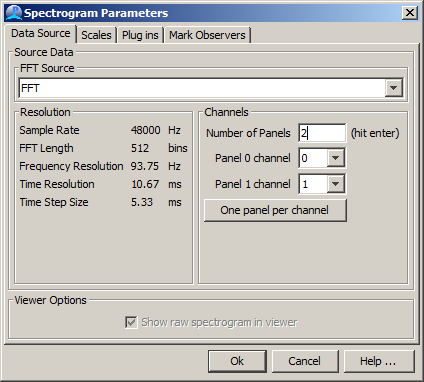
Select the desired FFT Data source. The spectrogram display requires a source of FFT data which will generally come from a FFT (Spectrogram) Engine PAMGuard module. The time and frequency resolution of the spectrogram display are controlled by how you’ve set up the FFT Engine. The FFT length and hop are very important, and can affect how easy it is to see sounds on your spectrogram display.
Each spectrogram window can have any number of separate spectrogram panels which will share the top section of the display. All display panels will use data from the same FFT data source, but any combination of channels from that data source is permitted.
For example, you may want to display each channel of data in a separate panel, so that all data on all channels can be viewed. On the other hand, you may want to display the same channel of data multiple times and overlay different detector data on each panel.
First set the number of panels required. The appropriate number of drop down lists, each offering a list of available channels will then change to reflect the number of panels.
Scales Tab

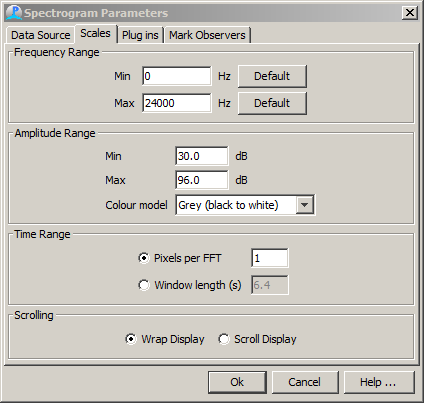
Set the Frequency Range; for the vertical axis. The default buttons will set these to range between 0 and to half the sampling frequency of the selected data source.
Set the Amplitude Rang;. For for a greyscale display min will be the amplitude value coding for white and the maximum will be the value coding for black.
Set the Time Range; this can either specify the number of pixels to display each bin of FFT data, or the length of time for the whole display (which may lead to a varying number of FFT partitions being displayed on each screen pixel).
A fixed number of pixels per FFT is the most efficient setting.
Plug ins Tab

Select he plug in display panels for the bottom section of the spectrogram window. The list of available plug-ins will depend on which detectors are available in the current PAMGuard configuration.
Mark Observers Tab

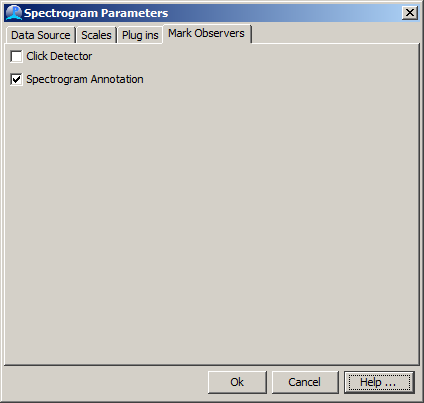
Mark Observers are PAMGuard modules that receive information from the computer mouse when it is dragged across the Spectrogram display. The list of mark observers will depend on which modules are available in the current PAMGuard configuration. Tick the check box for any modules that you wish to receive mouse movement information.
If one or more Mark Observers are selected, a red rectangle will appear on the spectrogram display panels when you press and drag the mouse across them. See the help documentation for the individual mark observers to see how they will use this information.