Configure User Display
DIFAR processing is an interactive process with the computer doing the bulk of the work, but an operator making critical decisions such as validating detections, classifying sounds by species, and selecting/rejecting sounds for further processing and localisation.
The DIFAR module does not have its own tab panel. Instead the various displays you�ll need should be configured on a user display panel. Create a user display panel from the File > Add Module > Displays > User Display menu.
On your user display(s) you will need to configure a spectrogram, a DIFAR Queue and a DIFAR Processing display. You may also want an additional map. A typical display configuration is shown below:

The DIFAR Display modules
Two different displays are required to run the DIFAR system. They are added separately to allow more flexibility in how the overall display system is laid out. The display first is a queue of selected or detected sounds which are waiting for DIFAR processing (i.e. localisation). The second display shows the output of DIFAR processing and allows the operator to make final decisions regarding the directionality of the detected sound, and ultimately allows validation, acceptance or rejection of the localisation results.
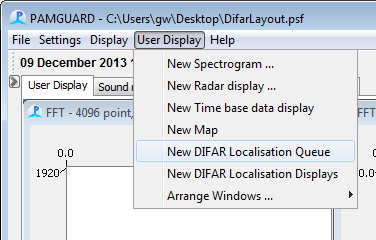
The Display modules are added from the User Display menu:

Add each of the display components in turn and drag them to the required positions on the screen.
Note that you can only add one each of the two DIFAR displays, so the menu items will go grey once you�ve added them.
The spectrogram
To create a spectrogram, from the User Display menu select User Display > New Spectrogram Display
Configure the spectrogram, right click > Settings… will reopen the dialog. Details of spectrogram configuration can be found here
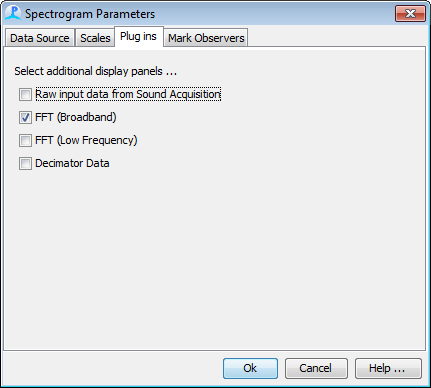
The spectrogram should display the FFT from the decimated data. For diagnostic purposes it�s useful to show the spectrum of the FFT from the raw 48kHz data as well. To show this, open the dialog and go to the �plug-ins� tab and check the box next to the data you want to display.
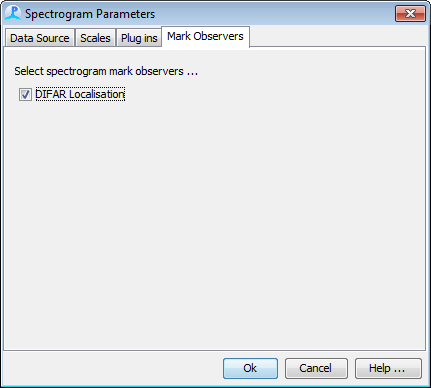
If you�re marking detections by hand on the spectrogram, then you also need to enable this feature by going to the Mark Observers tab and selecting the appropriate checkbox.

