Advanced Localisation (Triangulation and Groups)
The DIFAR Localisation module has two features intended to aid in real-time localisation of whales:
The ability to triangulate the location of a calling whale if the same call is received on two different sonobuoys.
The ability to average a time-series of bearings that are believed to originate from a group of calling whales.
Crossing Bearings
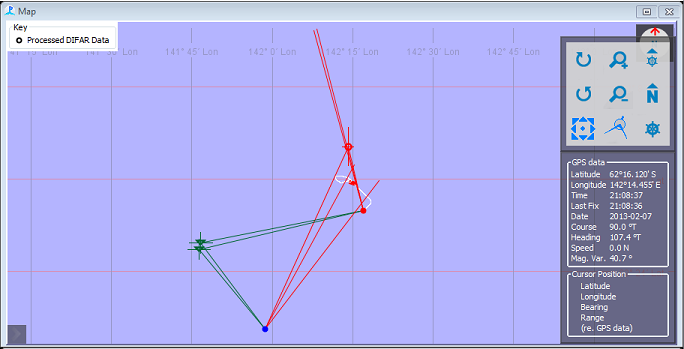
If more than one buoy is in use then the system will automatically attempt to cross bearings from two or more buoys to give a localisation of a sound source.

When a sound is processed and it�s bearing calculated, the system searches back through the list of recently processed DIFAR clips from other buoys and checks if any existing bearings from the same species are close enough in time that they may have been the same sound. If they are, then the crossing point is calculated.
NB: Crossing points are calculated on a rectangular grid, however sound propagation over long distances will typically follow a great-circle path. Thus crossing points that are very far from both of the sonobuoys may contain errors that arise from applying a rectangular grid that does account for the curved surface of the earth.
Tracked Groups
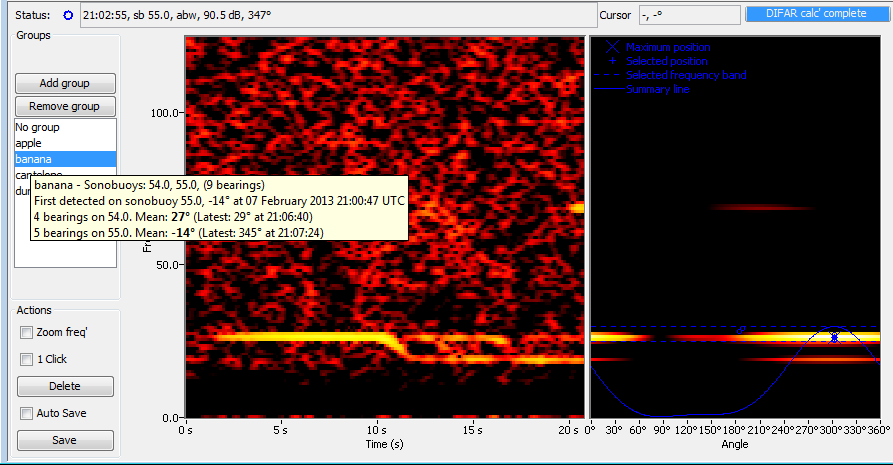
Groups is a feature that allows the operator to semi-automatically assign a text label to bearings that are believed to originate from a closely spaced group of calling whales. Summary statistics for each group are then calculated and can be plotted on the PAMGuard Map. The Groups panel on the DifarGram is used to manage and view the list of Groups as well as assign groups to DIFAR clips.

Adding and removing groups
Groups can be created and removed using the buttons. The Add group button will create a dialog-window that asks the user to type the name of a new group, and upon accepting the dialog-window the name of the new group is added to the list-box in the Groups panel. The Remove group button removes the currently-selected group’s label from the list-box. When a group is removed from the list-box, new bearings cannot be assigned to that group, however the PAMGuard database and map will retain the entry for that group. Groups that have been removed can be re-added to the list-box using the Add group button and typing the name of a previously removed group. NB: Group names are case sensitive, so “Apple” and “apple” are considered two different groups. The default group “No group” is always present in the list-box and cannot be removed. Summary statistics for the default group are not plotted on the map.
Assigning Groups
Assigning a group to a DIFAR clip involves selecting name of the group in the Groups panel before saving the clip. The selected/highlighted group will be assigned to the DIFAR clip when the clip is saved. The Groups module will then calculate a summary of the bearings from all of the DIFAR clips from that sonobuoy that were assigned to that group. Summary statistics include the mean and standard deviation of bearings to that group, the first and last bearings and detection times, and the total number of DIFAR clips assigned to that group. All summary statistics are calculated per-sonobuoy.
After the first clip has been assigned to a group, PAMGuard will suggest that DIFAR clips with closely matching bearings be assigned to that group. When new clips appear in the DifarGram, the group with the closest-matching mean-bearing will be automatically highlighted. PAMGuard will only suggest groups that match closely to the bearing selected in the DifarGram. If the closest-matching mean-bearing is more than 10 degrees from that of the clip, then the default group will be selected (i.e. PAMGuard will not attempt to creat new groups, but the user should feel free to do so). NB: Because summary statistics are created for each group per-sonobuoy, automatic suggestions for a group will not work on newly deployed sonobuoys until at least one DIFAR clip has been assigned to that group on that sonobuoy.
Viewing Summary Statistics

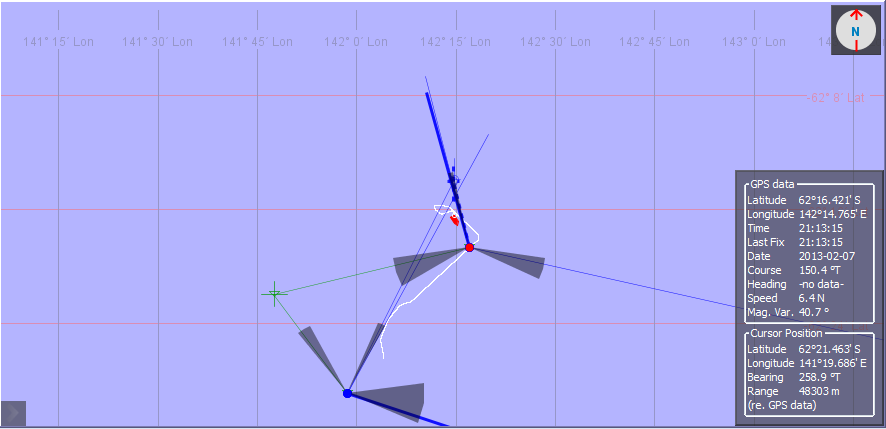
Tracked groups can be displayed on the PAMGuard Map in the same way as other detections (i.e. by right clicking on the map and selecting DIFAR Tracked Groups from the popup-menu). Tracked groups are shown on the map as semi-transparent wedges originating from each sonobuoy. The wedges are centred on the mean-bearing for that group, and the width of the wedges is four standard-deviations (two standard deviations anticlockwise from the mean-bearing, and two standard deviations clockwise from the mean-bearing). Hovering the mouse over the broad end of the wedge will popup the summary statistics for that group and that sonobuoy. Hovering the mouse over the name of the Group in the list-box on the DifarGram will display the summary statistics for all of the sonobuoys on which that group was detected.