Graphics Output
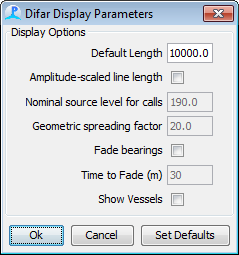
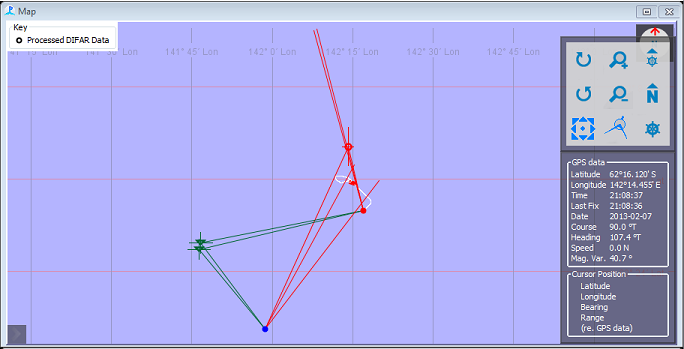
As well as the DIFAR queue and the DIFAR localisation display, the DIFAR system can overlay data on both the spectrogram and the PAMGuard map. Data from the DIFAR Queue and the Processed clips will automatically be included in lists of possible overlays for both these displays. Additional options are also available from the Display / DIFAR Localisation Display options menu.

Default length: This is the default length of lines drawn on the map. Amplitude scaling is in use If multiple buoys are in use and a crossing point has been calculated, then this value is ignored and lines are drawn as far as the crossing point.
Amplitude Scaling: If �Amplitude scaled line length� is selected, then a range is estimated based on a nominal source level, the received level, and the geometric spreading model of the form  where g is the geometric spreading factor.
Fade bearings: If the fade bearings button is selected, then lines drawn on the map will fade from solid to transparent over the set time period.
Show Vessels. If this is selected, bearings to vessels will be displayed as well as bearings to other sounds.
