Using DIFARGram Display

When DIFAR clips are processed from the DIFAR queue, they are sent to the DIFAR Localisation display where they are first demultiplexed in order to separate out the signals from the three acoustic sensors. Depending on the bandwidth and frequency resolution, demultiplexing may takes several seconds to perform on a typical 10 � 30s long clip, longer on slow computers. Progress is shown in the top right of the DIFAR Localisation display.
The Greeneridge demultiplexer has an inherent mechanism for determining whether a signal contains a correctly multiplexed DIFAR signal. Correct demodulation can only be achieved when the Greeneridge demultiplexer correctly locks onto the 7.5 and 15kHz carrier signals. The lock status is also shown in the progress bar, which will be red if the signal is not locked. If the signal doesn�t lock, then the clip should be discarded. NB: The AMMC demultiplexer does not presently contain any mechanism for determining whether a clip contains a correctly multiplexed DIFAR signal, thus when using the AMMC demultiplexer user experience and investigation of the directional signals may be required to determine whether the results of demodulation are sensible.
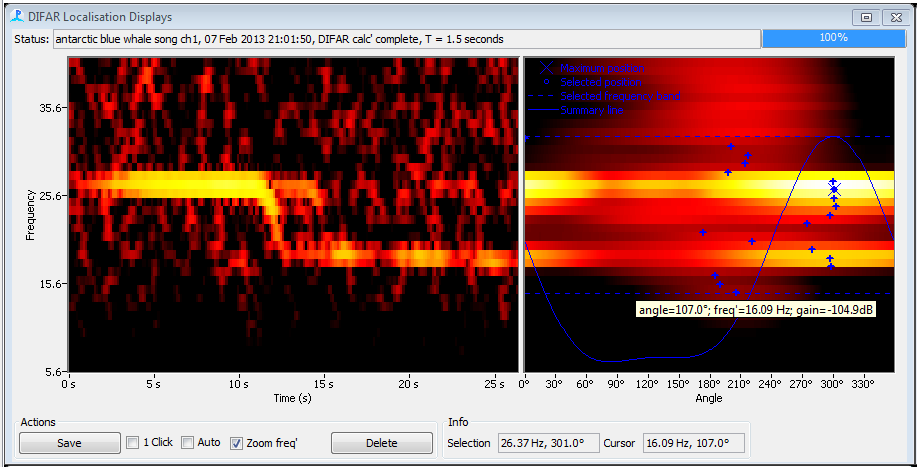
The display shows the spectrogram of the processed clip on the left with the DIFARGram on the right. By default, the spectrogram is created from the decimated raw input data (i.e. the omnidirectional hydrophone). Right clicking on the spectrogram allows the operator to display the signals from any of the three demultiplexed signals (i.e. omnidirectional, north-south, and east-west directional signals).
The DIFARGram is a colourmap of energy verses frequency and angle. There should be intense colour at the frequency of the selected sound and also at the angle from which the sound has arrived. To guide the eye a summary line is also displayed which shows the DIFARGram summed between the frequency limits of the clip. The summary line may be turned on and off by right clicking on the DIFARGram. The angle and frequency corresponding to the maximum energy are selected by default, and their values are shown as the Selection in the Info panel next to the DIFARGram.
At this time, the bearing calculated for the clip will be displayed on the PAMGuard map.