Overview
Localisation is the process by which the possible locations of an acoustic source are determined by an array of two or more receivers. In the case of underwater acoustics the receivers are hydrophones and if using PAMGuard the acoustic source is almost certainly a marine mammal.
Time Delays
In order to localise an acoustic source a time delay between two hydrophones is required. This simply refers the number of seconds between two hydrophones receiving the same acoustic signal. In order to get to this stage vocalisations must be first detected, classified and then the time delay between two likely signals from the same source calculated. The calculation itself must be highly accurate and cannot rely on simply determining the rough start of two signals without introducing large errors.
 |
|---|
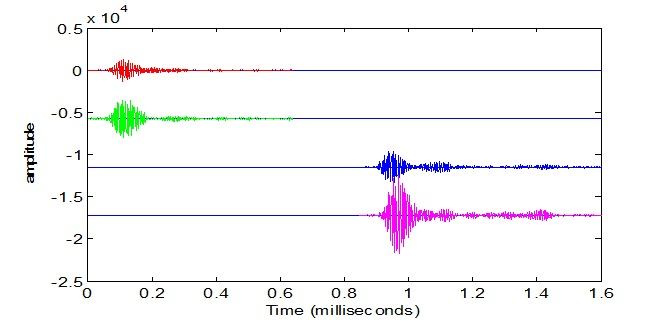
Figure 1.
For example a harbour porpoise click consists of an ultra-short directional pulse of sound with a peak frequency of around 130kHz . The complex internal structure of a cetacean’s biosonar means that click waveforms are not uniform and highly dependent on a multitude of factors. A ‘direct’ click detected along the longitudinal axis of the animal, for example, will differ in waveform from the same click recorded at an angle. Thus often incident on each hydrophone are clicks of similar peak frequency but very different waveforms as shown in Figure. 1. The distance between the hydrophones in this case was 0.25m. Although only a fraction of a millisecond in length in order to work out an accurate time delay between such clicks, a cross correlation function must be utilised. This method slides one waveform along the time axis of the other, calculating the integral of the product of both waveforms over a range of different times. The accepted mathematical form is
 |
|---|
where x(?) and y*(?-t) (* refers to the complex conjugate) represent two waveforms with a time separation of t. This results in the time dependent function Cxy(t). The integral is essentially proportional to the area beneath the two waveforms and so if they overlap precisely this produces a large value. Hence Cxy(t) is a measure of the similarity between two waveforms over time with its maximum value corresponding to the likely time delay between the two signals.
PAMGuard applies advanced time delay measurements to most of it’s time of arrival estimates, allowing the peak in the cross correlation function to be determined to a much higher accuracy than a single sample. You can read more in Gillespie and Macaulay, 2019.
Localising
As long as the distance between the two receiving hydrophones is known a measured time delay can then be used to restrict the possible location of an acoustic source. In the case of just two hydrophones the source is theoretically restricted to a three dimensional hyperboloid of infinite length. It is perhaps easier to visualise this in two dimensions in which case the hyperboloid can be considered as two possible symmetrical bearings pointing towards the source. By introducing another pair of hydrophones and hence another time delay measurement the location of the source can restricted further. Now the only possible locations are the points at which the hyperboloid surfaces calculated for each hydrophone pair cross.
 |
|---|
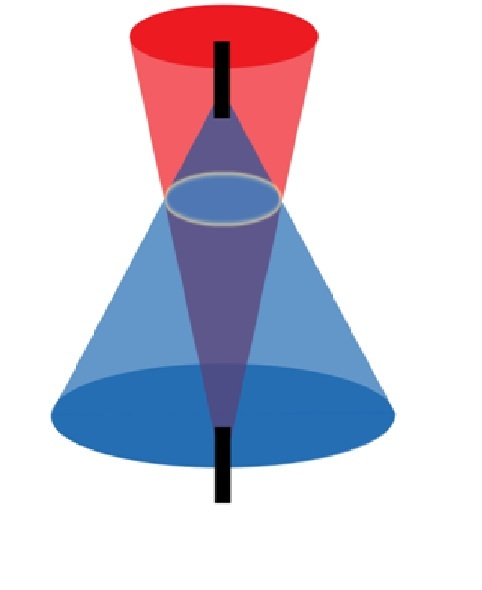
Figure 2 shows an example of two pairs of hydrophones (each pair is represented by a black box) each restricting the possible source locations to a hyperboloid surface (because the hydrophones are relatively close together the hyperboloid can be considered as two cones). The two cones intersect along a highlighted circle and hence the only possible locations of the source are on this circle. However there are four hydrophones in this array and hence this actually corresponds to six time delay measurements between hydrophones, 1-2, 1-3, 1-4, 2-3, 2-4 and 3-4. Thus it is possible to restrict the source location further depending on the array geometry. In Figure 2 the hydrophones are placed in-line with each other. This in-line symmetry results in the possible source locations always being restricted to a circle independent of the number of hydrophones used. In general the mathematical rules governing localisation require at least three hydrophones (two time delay measurements) to locate the source in two dimensions and at least four hydrophones (over three time delay measurements) to locate a source in three dimensions.
The number and distribution of hydrophones therefore play a key role in localisation; however other measurements also restrict the source location. The maximum detectable range of a harbour porpoise click is on the order of a few hundred meters whilst blue whales are detectable tens of kilometres away. Thus the possible ranges are restricted simply by the frequency of a vocalisation. In addition both the seabed and sea surface provide limits restricting the source location.
Localisation Errors
In an ideal world, if we knew the exact spacing between hydrophones, accurate sound speed profiles in all locations and the precise time delay of a signal it would be possible to localise the exact location of any detectable sound source. However, reality, down to the smallest fundamental units, is built on probability and the same applies to localisation. Errors in measurements, from digitising a signal to measuring the distance between different hydrophones, are inherent within every acoustic monitoring system. How this error propagates through to source positions is an important aspect of localisation and needs to be calculated accurately.
Time delay errors generally occur due to unsynchronised signals and/or errors in cross correlating different waves. For example, if a wave is digitally sampled every 1.41x10 -5 seconds (96kS/s) then in an ideal situation the time delay is accurate to +/- 1.41x10⁻⁵/2. This can be reduced by applying a polynomial fit to the cross correlation mimicking a more analogue wave. However, the cross correlation function itself is not always accurate, especially with spectrally pure signals, such as those produced by harbour porpoises. Therefore time delay errors, as well as being dependent on the sampling frequency are also often species dependent.
 |
|---|
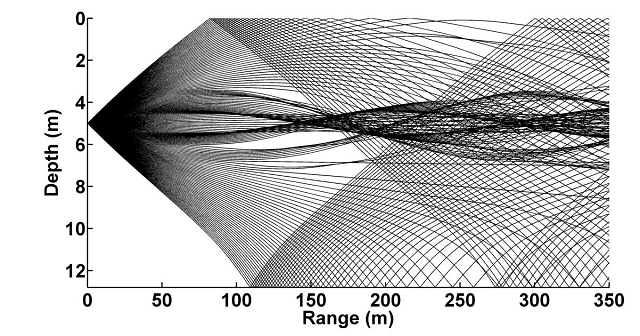
Propagation and speed of sound provide another important source of error. The speed of sound in seawater is not constant, with temperature, salinity and pressure gradients resulting in variable sound speed profiles. This results the bending of acoustic rays and can introduce a significant source of error, especially over large distances. Figure 3 shows a ray trace diagram of a porpoise click in a measured environment with a variable sound speed profile. Here temperature and salinity gradients cause significant bending of the acoustic signals creating a waveguide effect. Although this is an extreme case it is clear that assuming a constant sound speed in this particular instance would incur large localisation errors.
The geometry of an array is critical in error propagation. The first and most obvious error is the uncertainty in the position of each hydrophone. After a time delay measurement any error in the position of a hydrophone pair will alter the position of the resulting hyperboloid surface. This then changes the calculated possible source locations. The degree to which the source location is moved due to this and other errors is related to the geometry of the array. For example, consider two pairs of hydrophones, separated by 0.5m and located 1m apart from each other. Assume an error in measurement results in one of the calculated hyperboloid surfaces shifting by one degree; this then propagates to a range error of 1.9m. However if the hydrophone pairs are moved 10m apart the same error in measurement results in a range error of just 0.41m.
This suggests that arrays should be spaced as widely as possible. This is indeed the case with evenly distributed, widely spaced hydrophones theoretically providing the most accurate localisations. However, cetacean vocalisations only propagate a finite distance and depending on species are often highly directional. Therefore arrays are fundamentally restricted in size even before the practical considerations of deployment are taken into consideration.
The natural environment and especially the sea are fundamentally unpredictable places. The complexity of these environments means a complete and accurate mathematical model is impossible. Instead errors must be accepted as always present and localisations should always be regarded as probabilities of a source location.
References
Gillespie, D., and Macaulay, J. 2019. Time of arrival difference estimation for narrow band high frequency echolocation clicks, The Journal of the Acoustical Society of America, 146, EL387-EL392. doi:https://doi.org/10.1121/1.5129678.
Magnus Wahlberg, Bertel M�hl and Peter Teglberg. Estimating source position accuracy of a large-aperture hydrophone array for biacoustics. J. Acoust Soc. Am. 109. 397-405 (2001).
Stacy Lynn Deruiter. Echolocation-based foraging by harbour porpoises and sperm whales including effects of noise and acoustic propagation. PhD thesis (2008).
Line A. Kyhn, J. Tougard, F. Jensen, M. Wahlberg, G. Stone, A. Yoshinaga, K. Beedholm and P.T Madsen. Feeding at a high pitch. Source parameters of narrow band, high frequency clicks from echolocating off-shore Hourglass dolphins and coastal Hector’s dolphins. J. Acoust. Soc. Am .125, 1783-1791 (2009).
Mathew J. Holman, Joshua N. Winn, David W. Latham, Francis T. O’Donovan, DavidCharbonneau, Gaspar A. Bakos, Gilbert A. Esquerdo, Carl Hergenrother, Mark E. Everett and Andras Pal. The Transit light curve project. I. four consecutive transits of exoplanet XO-1b. The Astrophysical Journal. 652: 1715-1723 (2006).