Localising an Event
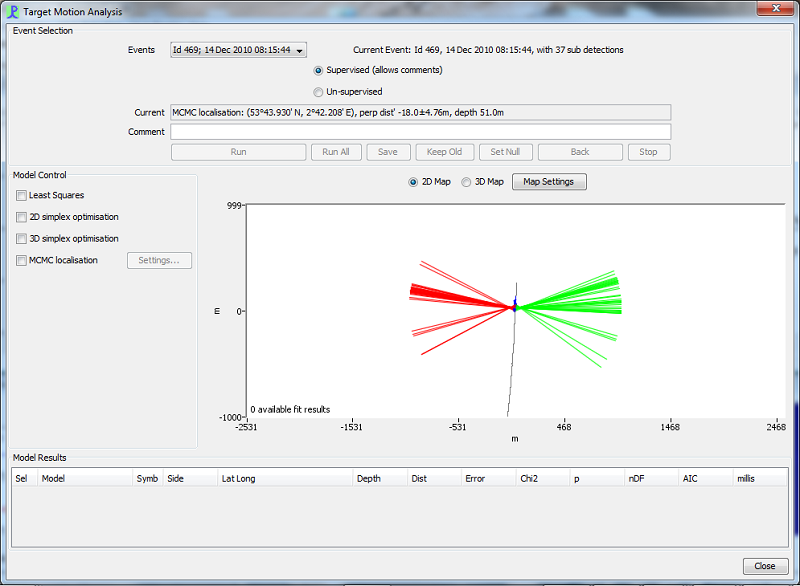
PAMGuard is capable of localising target motion data utilising multiple algorithms. In order to do so click trains must be marked out as described in the Click Detector Viewer Functions section. Once a click train has been marked as an event it can be localised either by right clicking on a click and selecting ‘Localise Click Train idxxx’ or selecting ‘Target Motion Analysis..’ from the ‘Click Detection’ drop down menu. This will open the target motion dialog panel.
 |
|---|
The Target Motion Analysis Panel consists of four sections.
Event Selection
The Event Selection panel is located at the top of the Target Motion Analysis window. The drop down menu allows different events to be selected.The ‘Run’ and ‘Run all’ button will attempt to localise each event using the selected localisation algorithms. Once the localisation algorithm(s) have run the results can be saved into the current database using the ‘Save’ button, disregarded using the ‘Keep Old’ button, or disregarded and if there are previous results, deleted, from the database using the ‘Set Null’ button.
Model Control
Model control allows the selection of different localisation algorithms described in the Target Motion Localisation Algorithms section. By default no algorithms are selected.
Map
The Map shows the trackline, bearing vectors to the source for each detected vocalisation and anylocalisation results. The Map can be switched between 2D and 3D views by selecting the 2D Map and 3D Map buttons at the top of the panel.
 |
|---|
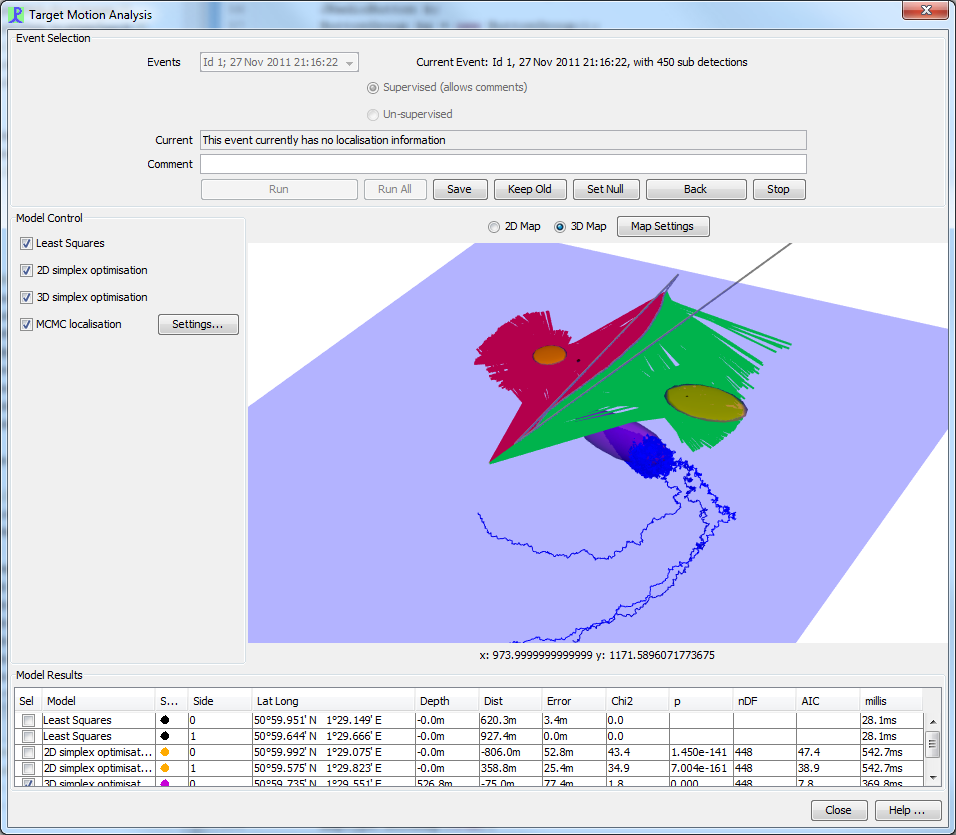
Figure 3

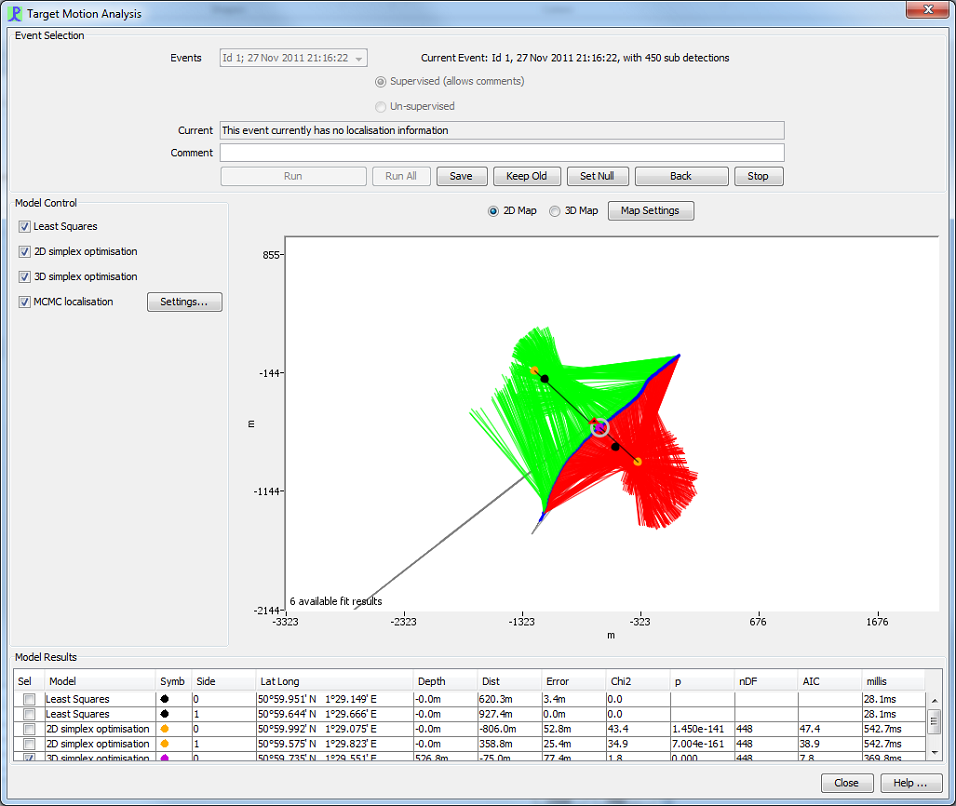
The 2D map shows a birds eye view of the event with ability to zoom using the mouse wheel and drag using either the left or right mouse buttons. Localisation results are represented as 2D symbols with a black line representing the perpendicular distance to the trackline. Figure 2 shows a 2D Map example of a sperm whale encounter with all four algorithms used to localise.
The 3D map is similar but with the ability to manipulate and rotate the map through three dimensions using the left mouse button. The 3D map also allows an intuitive display of the localisation errors calculated by each algorithm. Least Squares and Simplex2D/3D algorithms display the localisation results as translucent three dimensional ellipses with dimensions corresponding to the calculated localisation errors. For the MCMC algorithm each Markov chain is represented by a blue track showing an accurate probability distribution of the source location. Figure 3 shows the same encounter and localisation results as in Figure 2 but represented using the 3D map. A large MCMC probability distribution and Simplex3D ellipse show the likely source location in 3D with the 2D Simplex and Least Squares algorithms represented by yellow and black 3D ellipses on the sea surface.
Right clicking on either map will create a drop down menu with options to return the map to the original view, rotate by 90 degrees or change the length of the bearing vectors.
Results
The results pane shows the localisation results for each attempted algorithm. The algorithm which best fits the data is automatically selected however this can be changed by selecting the checkbox of any other result. The data from the selected result is saved to the connected database when the ‘Save’ button is pressed in the Event Selection panel. See the Target Motion Results section for a detailed explanation of the results table.