Model Viewer
The user can configure multiple PAMGuard modules in any number of ways, depending on the application. To assist the operator to appreciate how the different modules are connected and how data flows between them, the Data Model Viewer shows a graphical depiction of PAMGuard Modules and the processes and data within them.
The model viewer is opened from the File>Show Data Model menu command.
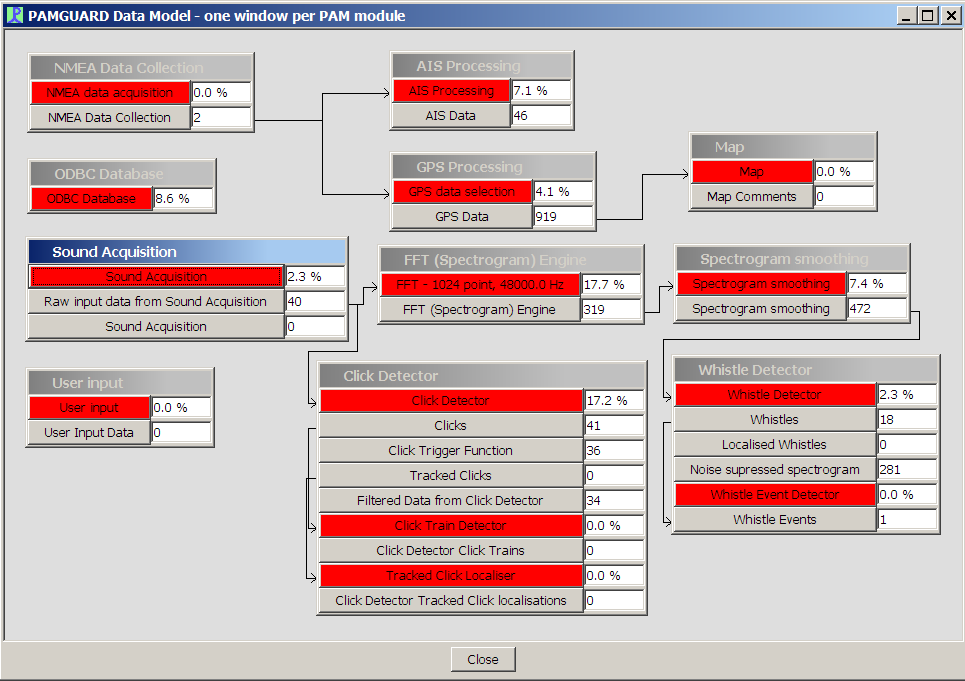
In this example, eleven modules are being used in the following ways:
Array Manager
Manages hydrophone locations and calibration information (always present in every configuration).Meta Data / Project Information
Project metadata (always present in every configuration).NMEA Data Collection
Acquires NMEA data from both GPS and AIS receivers (the data are multiplexed in the AIS receiver).GPS Processing
Takes NMEA data, identifies GPS strings and unpacks the data in them.Map
The Map display.Sound Acquisition
Acquires audio data in real time from a sound card.Click Detector
Searches for sperm whales and other odontocete clicks in teh raw audio data from the sound acquisition module.FFT (Spectrogram) Engine
Takes audio data from the Sound Acquisition module, and then computes FFT’s of blocks of data.Whistle and Moan Detector
Searches for dolphin whistles in the smoothed spectrogram data.User Display
General display panel which can show spectrograms and many other data displays, depending on your configuration.Binary Store
Controls writing of detailed detection data to binary storage files.Database
Controls writing of navigation and detector data to a database.Sound Output
Plays sound back through the system speakers, or other compatible sound output device.
For each module, PAMGuard processes are shown in red. Some modules contain multiple processes. The percentage of available CPU power being used by each process is shown just to the right of the red box. Clicking on the red box with the right mouse button will often bring up a menu of options controlling that process.
Below each process there are one or more grey boxes. These represent data streams within PAMGuard. Data held within data streams may be of many kinds: blocks of raw audio data from the sound card, units of GPS data, and detected clicks and click trains are just examples. The number to the right of each grey box shows the number of data units currently held in memory for each data stream.
Only the main data flows from data streams to PAMGuard processes are shown by the arrows. So for example, although the database will be monitoring and receiving data from all data streams, yet no arrows are shown going into the database process.
Clicking on one of the grey data streams will bring up a window showing the full list of subscribers to that data stream.
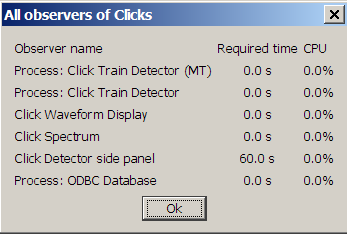
The window also shows for how long the subscribing module requires the data to be held in memory and also how much CPU the subscriber processes are using.
Right clicking on blank space in the Model Viewer brings up a menu from where the user can add and remove PAMGuard modules.