PAMGuard Viewer
The PAMGuard viewer can be used to view data stored in the PAMGuard database and the binary storage system.
Some viewer operations, such as the spectrogram display also load and re-process small amounts of raw audio data from sound files (if available).
Starting PAMGuard Viewer
The PAMGuard viewer can be started from the shortcut to PAMGuard Viewer placed on your system when you installed PAMGuard.
If you are using one of the platform independent jar files, then run the jar file with the program argument -v. For instance, under Windows, the command line for starting PAMGuard Beta version 1.3.02 in viewer mode with 1 Gigabyte of memory is:
java -jar -mx4096m PAMGuardBeta_2_02_15.jar PAMGuard -v
Running PAMGuard Viewer
When PAMGuard starts in Viewer mode, it will not ask for a psfx file, but will instead ask for a database file to open. Normally, you should select a database which was previously filled with data from PAMGuard. However, if data were collected using only Binary Storage, then open a blank database and ignore any warning messages.
When running in normal mode, PAMGuard writes settings to a table in the database and Viewer mode will read the settings back from the database. This ensures that the PAMGuard configuration you are viewing will be compatible with the data in the database.
For more information on how to begin your analysis go to Click Viewer Overview.
Data Scrolling
It is not possible to load entire large data sets into the Viewer since the program will run out of memory. On the other hand, it is inefficient to continually be loading data for display whenever the operator scrolls back or forth by a few seconds.
The PAMGuard viewer therefore uses a sophisticated double scroll system in which an outer scroller controls the loading of data into memory and an inner scroller moves through that data. For example, when viewing clicks with the click detector, an operator will probably want to load about 30 minutes of data at a time, but may only view minutes or seconds of those loaded data as they make a detailed analysis of the clicks.
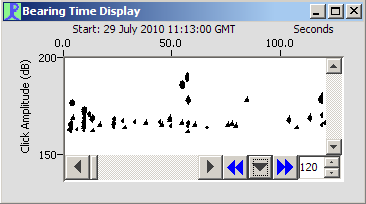
Exactly which options are available on individual displays with PAMGuard can vary. However, the functionality will generally be a subset of that in the click detector:

The main part of the scroller (taking up most of the space on the left) is an ordinary scroll bar which allows you to navigate through loaded data. To the right are a pair of blue arrow buttons with a downward arrow button between them. The blue buttons are used to load the next section of data (e.g. to jump forward or backward half an hour).
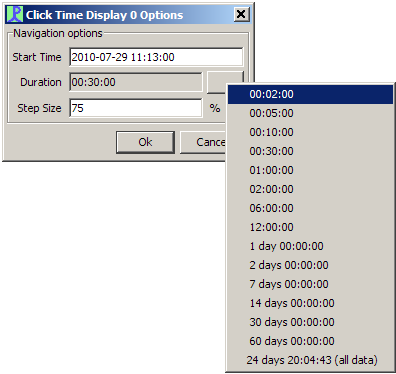
Click on the downward pointing arrow to display other options:

Options include the start time of the loaded data, the time period of the loaded data and the percentage movement forward or backward when the blue arrows are pressed. (In the example above, 30 minutes of data are loaded, and there is a 75% step size, so the blue arrows would move forward or backward by 22.5 minutes).
Right click on the downward arrow for an option to couple all scrollers in all PAMGuard modules.
The number in the right hand box shows the duration of data actually displayed in the window (120 seconds in the example). This can be changed by typing a new number or by using the tiny up and down arrow in the right of the edit box.
To assist in navigating through large data sets, the Data Map will always be added to the PAMGuard model when operating in Viewer mode.