Filter Design
Two main types of filter are available in PAMGuard. IIRF (Infinite Impulse Response) Filters are generally preferred since they are faster than the alternative FIR (Finite Impulse Response) filter types. However there may be circumstances when you prefer to use an FIR filter, particularly if an unusual filter response is required (for instance, one mimicking the hearing response of an animal, or with multiple ‘notches’ to remove noise).
Butterworth filters have a flat response over frequencies in the pass band, so are preferred for any processes that will be making noise measurements downstream of the filter.
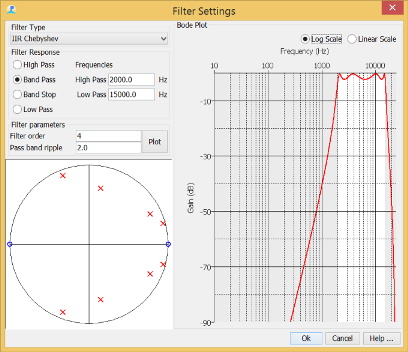
Chebyshev filters have a slightly better attenuation, but at the expense of some ripple in the pass band.
Both types of filter can be configured from within PAMGuard’s filter design panel. This is used in the stand alone Filters Module, but also appears in the configuration for several other modules, including the click detector, the Decimator and some noise measurement modules.
Configuration

Filter Type
Select the type of filter, which can be one of: “None”, “IIR Butterworth”, “IIR Chebyshev”, “FIR Filter (Window Method)”, “Arbitrary FIR Filter”.
Filter Response
For Butterworth, Chebychev and FIR Filters using the Window Method, select either a High pass, Band Pass, Band Stop or Low Pass response and the filter cut off frequencies in Hz. Note that these should be greater than 0 and less than half of the sample rate.
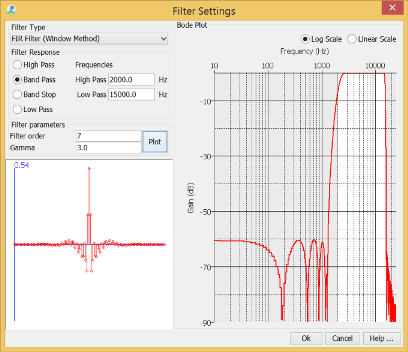
Also set the filter order - this controls how steeply the filter will attenuate close to the cut off frequencies. High order filters use more processing power than low order ones and can also have a long impulse response which can reduce the time resolution of transient signals. Note that for FIR filters, the filter order parameter that you enter is actually the log base 2 of the length of the actual filter, i.e. a filter order of 6 will generate 64 tap filer, 7 a 128 tap filter, etc.
For Chebychev filters, you can also set the amount of ripple in the passband and for FIR filters, you can set ‘gamma’ which alters the rate of filter attenuation verses ripple in the stop band.
For IIR filters, in the lower left part of the dialog, you will see a pole-zero diagram. For FIR filters, this is replaced by the filter taps, or impulse response of the filter.

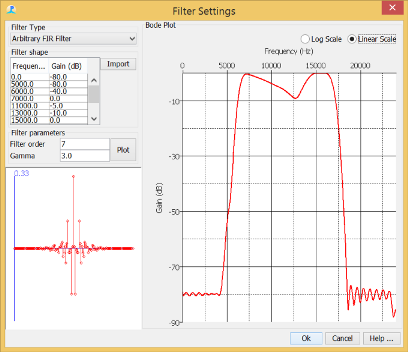
If you have selected an FIR Arbitrary filter, the dialog will change to show a list of frequencies and gains.

It’s currently only possible to update this list by creating and editing a text file, which should be a comma separated list of frequencies and gains, e.g.
0, -80
5000, -80
6000, -40
7000, 0
11000, -5
13000, -10
15000, 0
17000, 0
17000, -30
18000, -80
24000, -80
Use the import button to import the values from your text file
Bode Plot
The filter dialog displays a bode plot (attenuation verses frequency) for the chosen filter parameters. You can show this on either a logarithmic of linear frequency scale. Double clicking the amplitude axis will change the range of the amplitude scale.
Pole-Zero or Impulse Response Plot
In the lower left corner you will see either a plot of the filters Impulse Response, or a Pole-Zero plot (IIR Filters only). The Impulse response of a filter is the signal that will come out of a filter if a single unit sample is input to the filter, i.e. a 1 followed by an infinite number of zeros. It is important to understand since it shows how a filter will distort a waveform, generally delaying it, and elongating it in time. Particularly for very short sounds, such as dolphin echolocation clicks, the waveform you see in the click detector may be a function of any filters you’ve included in the detector as much as it is a function of the sound coming out of the animal.
Pole Zero plots are a part of IIR Filter design, but understanding them is probably not important to most PAMGuard users. When designiing IIR Filters, you can switch between pole-zero and impulse responde plots by right clicking on the display.