Data Map
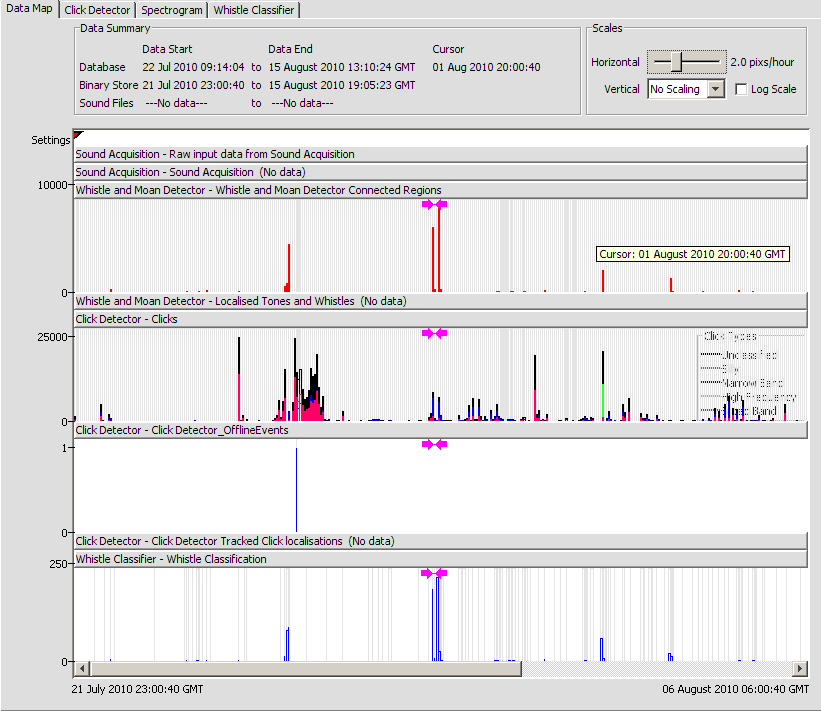
Key to PAMGuard viewer operation is the data map which provides an overview of all data available to the viewer.
There is never a need to create a data map since it is created automatically whenever PAMGuard is operating in Viewer mode. The data map is not available in other operation modes.

The data map shows a general overview of all data available to viewer mode, which may be over a time scale of minutes to years.
The data map allows you to easily navigate through the data
Data density graphs
Most of the data map is taken up by a series of data density graphs. These show the number of available data units per hour (in the case of data in the database) or per binary file for data stored in binary files.
You can double click on the title bar of each data density graph to minimise unwanted graphs (thereby making more room for others). Graphs with no data are minimised by default.
Loading Settings
Each time PAMGuard is started, settings are stored in the database and in the binary storage system. The times at which settings were stored are shown by small triangles in the “Settings” strip near the top of the data map. Hover the mouse over any of these triangles to see a list of modules in use at that time. To load a particular set of PAMGAURD settings, right click on the triangle and execute the pop up menu command.
Data Map Scales
Use the “scales” slider in the top right corner of the data map to control the horizontal scrolling
Use the drop down list to select the vertical scaling of the plots.