Whistle Detector Display
The whistle detector does not have it’s own tab panel display.
Whistle detector data can be viewed on a side panel and as a graphic overlay on spectrogram displays.
Whistle side panel

A side panel shows a count of recent whistles and whistle events
Spectrogram graphics overlay

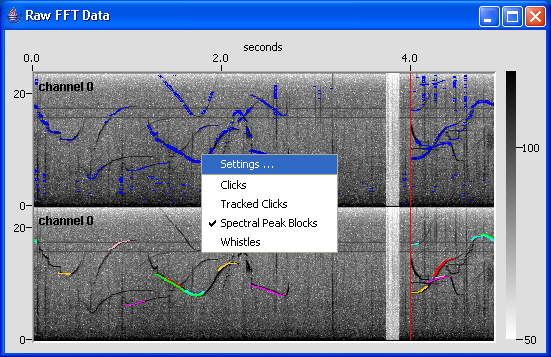
On a spectrogram display panel pop up menu (right click anywhere on the spectrogram display panel), select which detector overlays to display.
Whistles are currently only detected on the first channel of a grouped pair of channels, and whistle output displays will only overlay on the spectrogram of the the channel from which the detections were made.
In the example, in order to show both spectral peaks and whistles channel 0 is displayed in two panels; one has an overlay of spectral peaks, the other an overlay of detected whistles.